29
/fr/
fr
AIzaSyAYiBZKx7MnpbEhh9jyipgxe19OcubqV5w
April 1, 2024
178841
Liberia
LBR
true
2
1
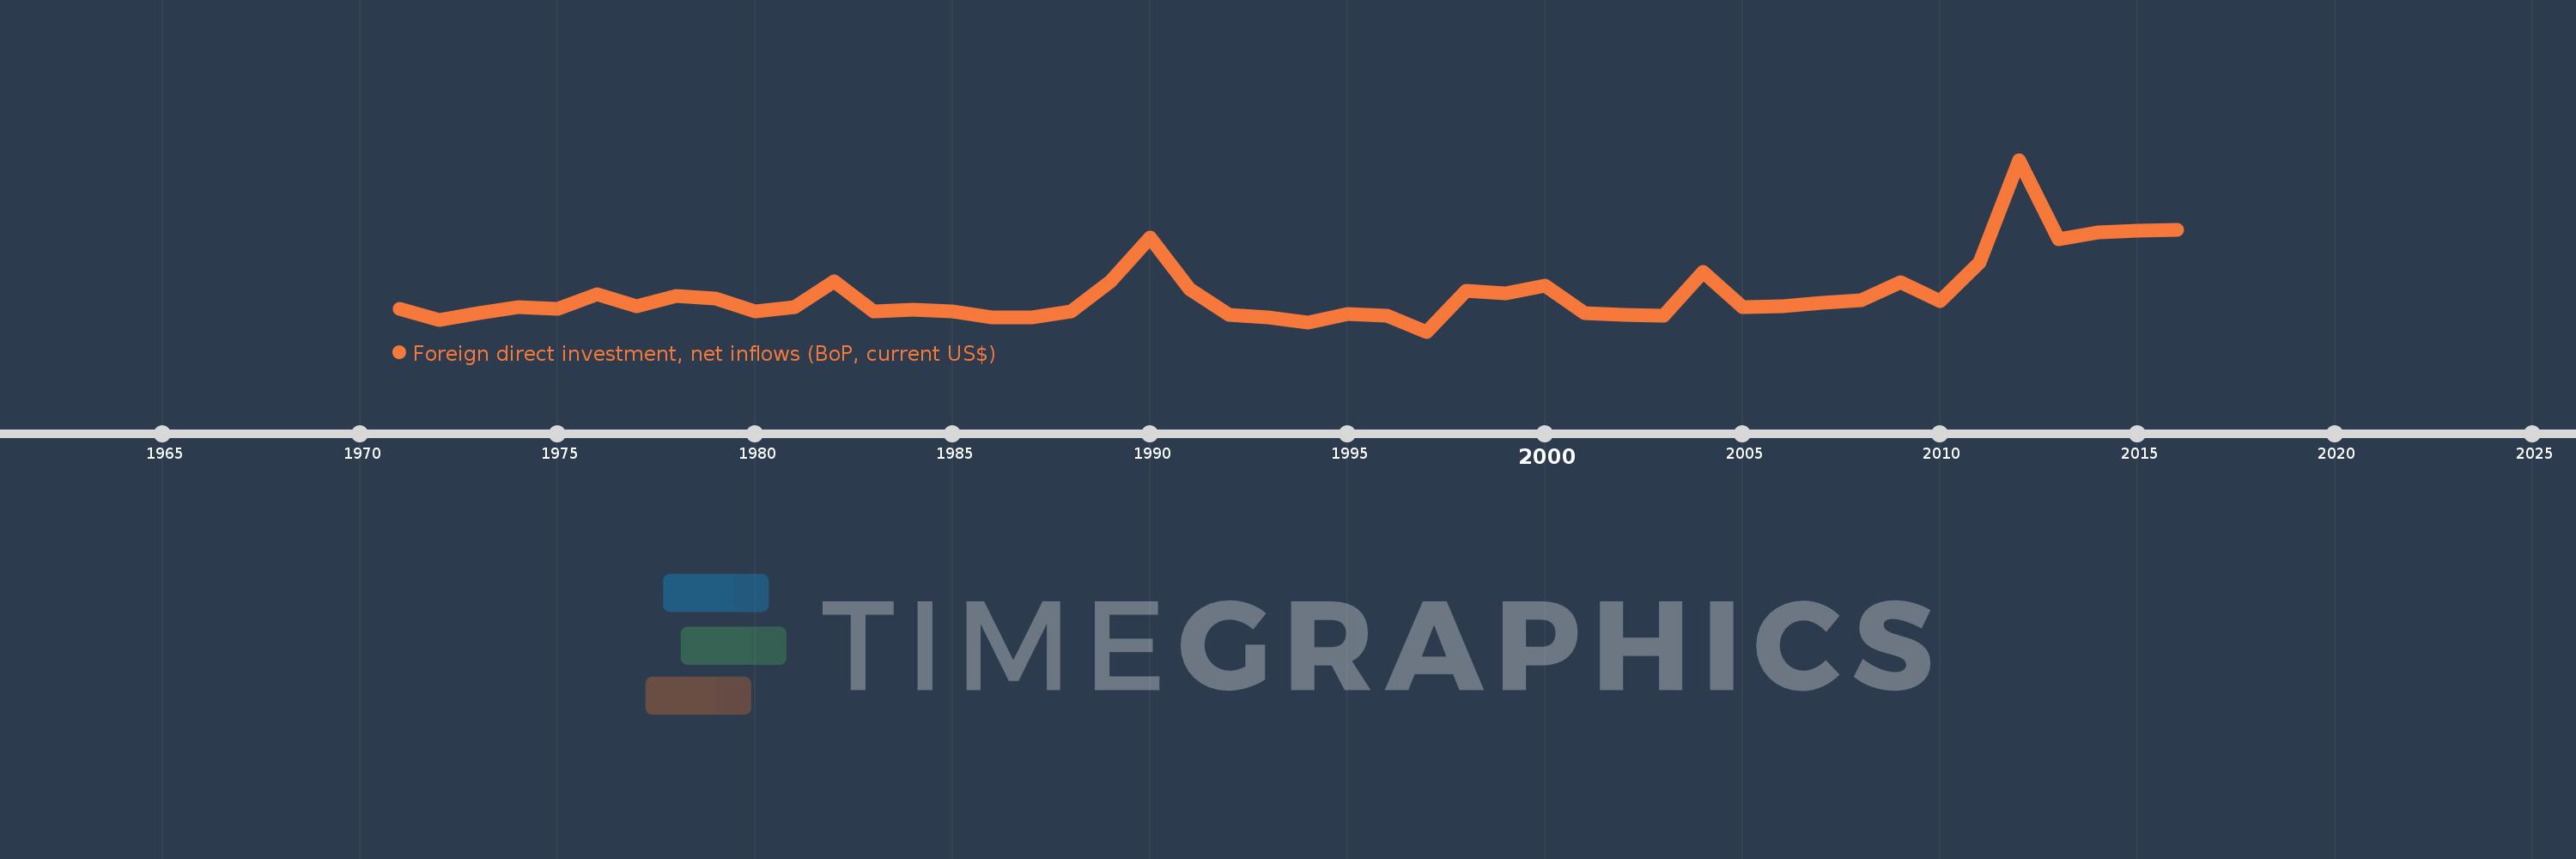
Foreign direct investment, net inflows (BoP, current US$)
2016,2015,2014,2013,2012,2011,2010,2009,2008,2007,2006,2005,2004,2003,2002,2001,2000,1999,1998,1997,1996,1995,1994,1993,1992,1991,1990,1989,1988,1987,1986,1985,1984,1983,1982,1981,1980,1979,1978,1977,1976,1975,1974,1973,1972,1971
Cette statistique dans les autres pays:
AfghanistanAlbaniaAlgeriaAngolaAntigua and BarbudaArab WorldArgentinaArmeniaArubaAustraliaAustriaAzerbaijanBahamas, TheBahrainBangladeshBarbadosBelarusBelgiumBelizeBeninBermudaBhutanBoliviaBosnia and HerzegovinaBotswanaBrazilBritish Virgin IslandsBrunei DarussalamBulgariaBurkina FasoBurundiCabo VerdeCambodiaCameroonCanadaCaribbean small statesCayman IslandsCentral African RepublicCentral Europe and the BalticsChadChileChinaColombiaComorosCongo, Dem. Rep.Congo, Rep.Costa RicaCote d'IvoireCroatiaCuracaoCyprusCzech RepublicDenmarkDjiboutiDominicaDominican RepublicEarly-demographic dividendEast Asia & PacificEast Asia & Pacific (excluding high income)East Asia & Pacific (IDA & IBRD countries)EcuadorEgypt, Arab Rep.El SalvadorEquatorial GuineaEritreaEstoniaEthiopiaEuro areaEurope & Central AsiaEurope & Central Asia (excluding high income)Europe & Central Asia (IDA & IBRD countries)European UnionFijiFinlandFragile and conflict affected situationsFranceFrench PolynesiaGabonGambia, TheGeorgiaGermanyGhanaGibraltarGreeceGrenadaGuatemalaGuineaGuinea-BissauGuyanaHaitiHeavily indebted poor countries (HIPC)High incomeHondurasHong Kong SAR, ChinaHungaryIBRD onlyIcelandIDA & IBRD totalIDA blendIDA onlyIDA totalIndiaIndonesiaIran, Islamic Rep.IraqIrelandIsraelItalyJamaicaJapanJordanKazakhstanKenyaKiribatiKorea, Dem. People’s Rep.Korea, Rep.KosovoKuwaitKyrgyz RepublicLao PDRLate-demographic dividendLatin America & Caribbean Latin America & Caribbean (excluding high income)Latin America & the Caribbean (IDA & IBRD countries)LatviaLeast developed countries: UN classificationLebanonLesothoLiberiaLibyaLithuaniaLow & middle incomeLow incomeLower middle incomeLuxembourgMacao SAR, ChinaMacedonia, FYRMadagascarMalawiMalaysiaMaldivesMaliMaltaMarshall IslandsMauritaniaMauritiusMexicoMicronesia, Fed. Sts.Middle East & North AfricaMiddle East & North Africa (excluding high income)Middle East & North Africa (IDA & IBRD countries)Middle incomeMoldovaMongoliaMontenegroMoroccoMozambiqueMyanmarNamibiaNauruNepalNetherlandsNew CaledoniaNew ZealandNicaraguaNigerNigeriaNorth AmericaNorthern Mariana IslandsNorwayOECD membersOmanOther small statesPacific island small statesPakistanPalauPanamaPapua New GuineaParaguayPeruPhilippinesPolandPortugalPost-demographic dividendPre-demographic dividendQatarRomaniaRussian FederationRwandaSamoaSao Tome and PrincipeSaudi ArabiaSenegalSerbiaSeychellesSierra LeoneSingaporeSint Maarten (Dutch part)Slovak RepublicSloveniaSmall statesSolomon IslandsSomaliaSouth AfricaSouth AsiaSouth Asia (IDA & IBRD)South SudanSpainSri LankaSt. Kitts and NevisSt. LuciaSt. Vincent and the GrenadinesSub-Saharan Africa Sub-Saharan Africa (excluding high income)Sub-Saharan Africa (IDA & IBRD countries)SudanSurinameSwazilandSwedenSwitzerlandSyrian Arab RepublicTajikistanTanzaniaThailandTimor-LesteTogoTongaTrinidad and TobagoTunisiaTurkeyTurkmenistanTuvaluUgandaUkraineUnited Arab EmiratesUnited KingdomUnited StatesUpper middle incomeUruguayUzbekistanVanuatuVenezuela, RBVietnamWest Bank and GazaWorldYemen, Rep.ZambiaZimbabwe La ligne de temps
Cette échelle de temps montre un graphique de 1971 année à 2016 année Liberia. Les données jusqu'à 1970 année ne sont pas présentés. Quantité d'observations actuelles selon dates: 46.
Source (désignation):
Les indicateurs du développement mondiale
Source (organisation):
International Monetary Fund, Balance of Payments database, supplemented by data from the United Nations Conference on Trade and Development and official national sources.
Catégories:
Economy & Growth, Financial Sector, External Debt
Dernière mise à jour
23 avr. 2017
Les indicateurs de changement de valeurs selon les années
Minimum:
-132.13 mln.
1 janv. 1997
Maximum:
1.313 mds
1 janv. 2012
Pour la date d''observation
Valeur
Changement absolu
Le changement par rapport à la valeur précédente
1 janv. 1971
57.14 mln.
+57.14 mln.
0.0%
1 janv. 1972
-33.96 mln.
-91.1 mln.
-159.43%
1 janv. 1973
20.65 mln.
+54.61 mln.
-160.81%
1 janv. 1974
74.84 mln.
+54.19 mln.
262.42%
1 janv. 1975
57.71 mln.
-17.13 mln.
-22.89%
1 janv. 1976
180.41 mln.
+122.7 mln.
212.61%
1 janv. 1977
83.17 mln.
-97.24 mln.
-53.9%
1 janv. 1978
170.45 mln.
+87.28 mln.
104.94%
1 janv. 1979
144.69 mln.
-25.76 mln.
-15.11%
1 janv. 1980
41.21 mln.
-103.48 mln.
-71.52%
1 janv. 1981
71.92 mln.
+30.71 mln.
74.52%
1 janv. 1982
287.95 mln.
+216.03 mln.
300.38%
1 janv. 1983
34.8 mln.
-253.15 mln.
-87.91%
1 janv. 1984
49.1 mln.
+14.3 mln.
41.09%
1 janv. 1985
36.2 mln.
-12.9 mln.
-26.27%
1 janv. 1986
-16.2 mln.
-52.4 mln.
-144.75%
1 janv. 1987
-16.5 mln.
-300.0 milles
1.85%
1 janv. 1988
38.5 mln.
+55.0 mln.
-333.33%
1 janv. 1989
290.15 mln.
+251.65 mln.
653.64%
1 janv. 1990
656.04 mln.
+365.89 mln.
126.1%
1 janv. 1991
225.24 mln.
-430.8 mln.
-65.67%
1 janv. 1992
8.41 mln.
-216.83 mln.
-96.27%
1 janv. 1993
-10.85 mln.
-19.26 mln.
-229.01%
1 janv. 1994
-53.62 mln.
-42.77 mln.
394.19%
1 janv. 1995
17.38 mln.
+71.0 mln.
-132.41%
1 janv. 1996
4.6 mln.
-12.78 mln.
-73.53%
1 janv. 1997
-132.13 mln.
-136.73 mln.
-2.97 milles%
1 janv. 1998
213.82 mln.
+345.95 mln.
-261.83%
1 janv. 1999
190.31 mln.
-23.51 mln.
-11.0%
1 janv. 2000
256.26 mln.
+65.95 mln.
34.65%
1 janv. 2001
20.8 mln.
-235.46 mln.
-91.88%
1 janv. 2002
8.3 mln.
-12.5 mln.
-60.1%
1 janv. 2003
2.8 mln.
-5.5 mln.
-66.27%
1 janv. 2004
372.22 mln.
+369.42 mln.
13.19 milles%
1 janv. 2005
75.352 mln.
-296.868 mln.
-79.76%
1 janv. 2006
82.802 mln.
+7.45 mln.
9.89%
1 janv. 2007
107.857 mln.
+25.055 mln.
30.26%
1 janv. 2008
131.638 mln.
+23.781 mln.
22.05%
1 janv. 2009
283.536 mln.
+151.898 mln.
115.39%
1 janv. 2010
127.803 mln.
-155.733 mln.
-54.93%
1 janv. 2011
452.342 mln.
+324.539 mln.
253.94%
1 janv. 2012
1.313 mds
+860.406 mln.
190.21%
1 janv. 2013
646.6 mln.
-666.148 mln.
-50.74%
1 janv. 2014
700.268 mln.
+53.668 mln.
8.3%
1 janv. 2015
720.076 mln.
+19.808 mln.
2.83%
1 janv. 2016
721.033 mln.
+957.396 milles
0.13%
Classement des pays selon les statistiques actuelles par années


Commentaires: