29
/fr/
fr
AIzaSyAYiBZKx7MnpbEhh9jyipgxe19OcubqV5w
April 1, 2024
264583
Togo
TGO
true
2
1
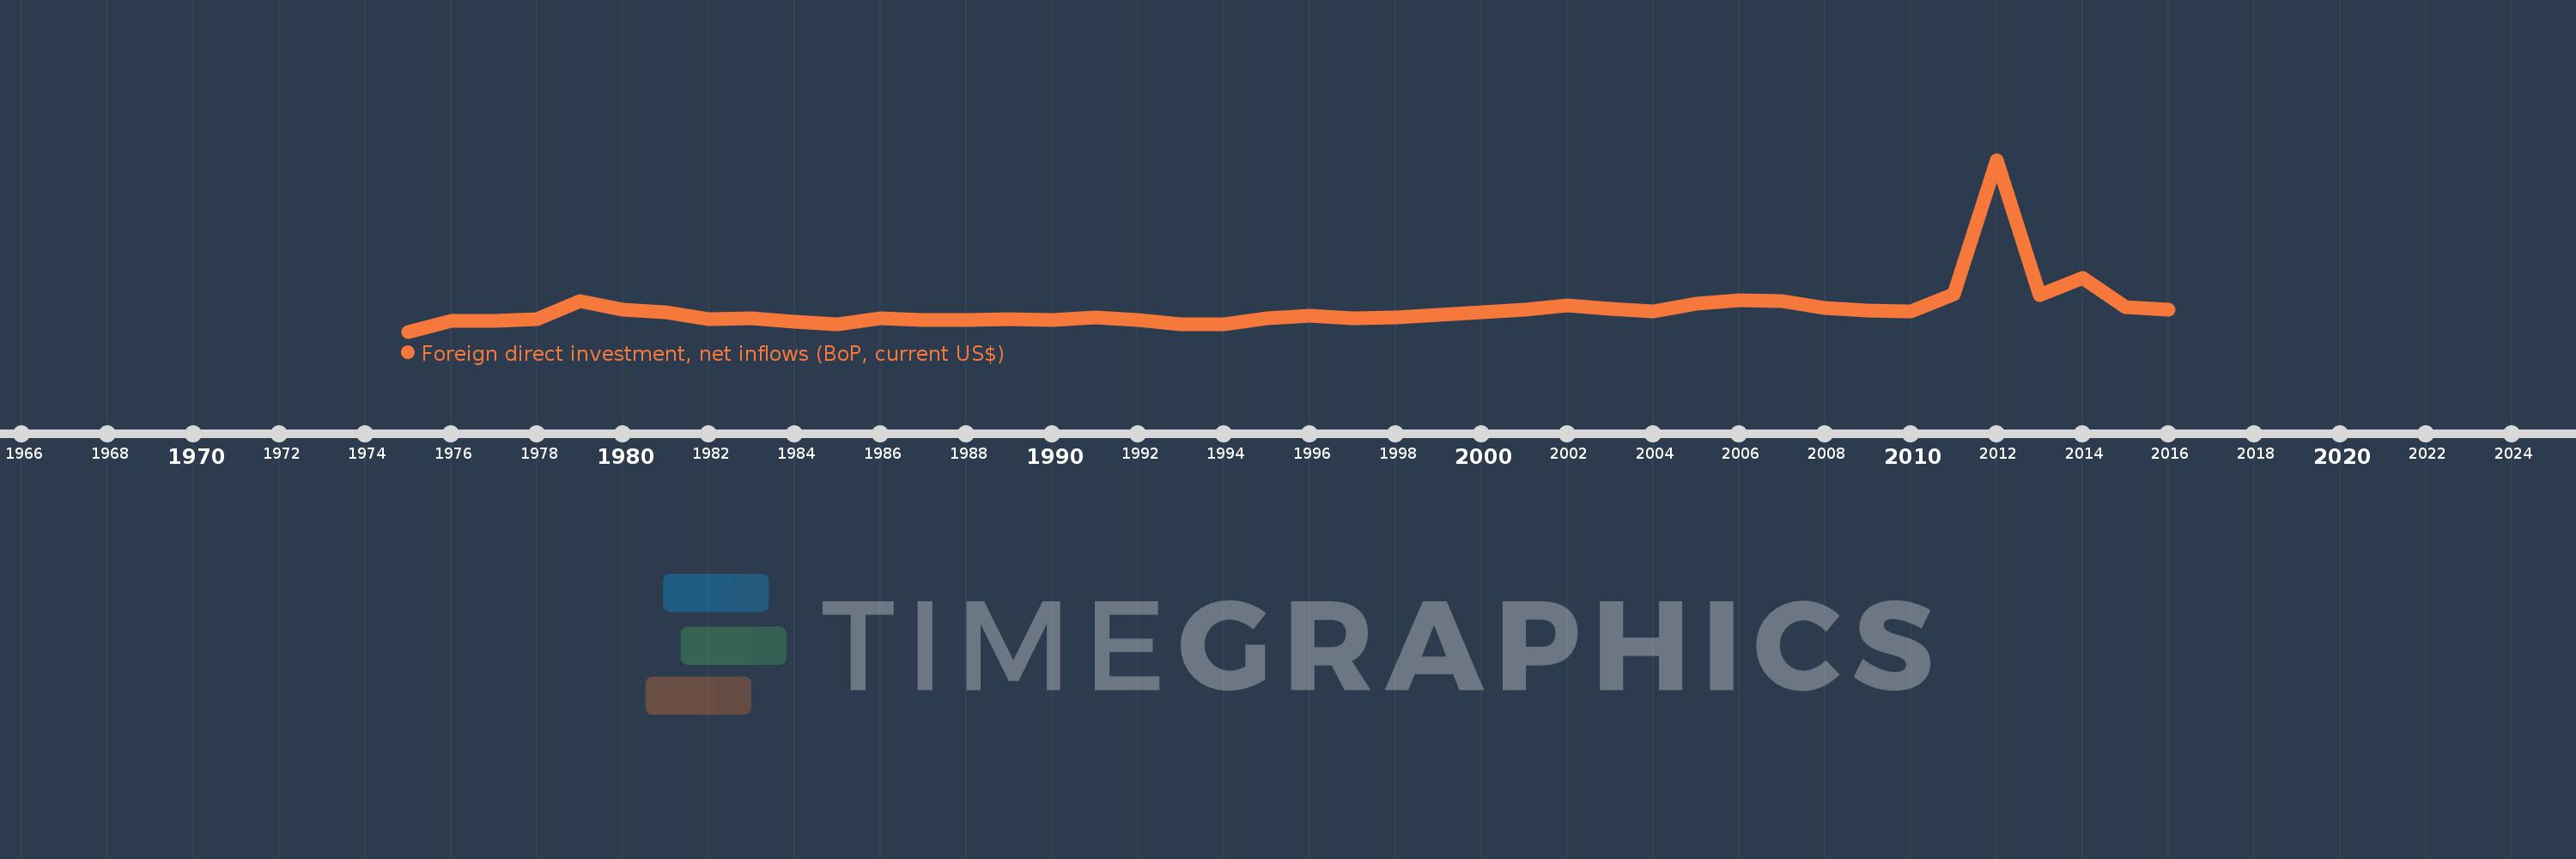
Foreign direct investment, net inflows (BoP, current US$)
2016,2015,2014,2013,2012,2011,2010,2009,2008,2007,2006,2005,2004,2003,2002,2001,2000,1999,1998,1997,1996,1995,1994,1993,1992,1991,1990,1989,1988,1987,1986,1985,1984,1983,1982,1981,1980,1979,1978,1977,1976,1975
Cette statistique dans les autres pays:
AfghanistanAlbaniaAlgeriaAngolaAntigua and BarbudaArab WorldArgentinaArmeniaArubaAustraliaAustriaAzerbaijanBahamas, TheBahrainBangladeshBarbadosBelarusBelgiumBelizeBeninBermudaBhutanBoliviaBosnia and HerzegovinaBotswanaBrazilBritish Virgin IslandsBrunei DarussalamBulgariaBurkina FasoBurundiCabo VerdeCambodiaCameroonCanadaCaribbean small statesCayman IslandsCentral African RepublicCentral Europe and the BalticsChadChileChinaColombiaComorosCongo, Dem. Rep.Congo, Rep.Costa RicaCote d'IvoireCroatiaCuracaoCyprusCzech RepublicDenmarkDjiboutiDominicaDominican RepublicEarly-demographic dividendEast Asia & PacificEast Asia & Pacific (excluding high income)East Asia & Pacific (IDA & IBRD countries)EcuadorEgypt, Arab Rep.El SalvadorEquatorial GuineaEritreaEstoniaEthiopiaEuro areaEurope & Central AsiaEurope & Central Asia (excluding high income)Europe & Central Asia (IDA & IBRD countries)European UnionFijiFinlandFragile and conflict affected situationsFranceFrench PolynesiaGabonGambia, TheGeorgiaGermanyGhanaGibraltarGreeceGrenadaGuatemalaGuineaGuinea-BissauGuyanaHaitiHeavily indebted poor countries (HIPC)High incomeHondurasHong Kong SAR, ChinaHungaryIBRD onlyIcelandIDA & IBRD totalIDA blendIDA onlyIDA totalIndiaIndonesiaIran, Islamic Rep.IraqIrelandIsraelItalyJamaicaJapanJordanKazakhstanKenyaKiribatiKorea, Dem. People’s Rep.Korea, Rep.KosovoKuwaitKyrgyz RepublicLao PDRLate-demographic dividendLatin America & Caribbean Latin America & Caribbean (excluding high income)Latin America & the Caribbean (IDA & IBRD countries)LatviaLeast developed countries: UN classificationLebanonLesothoLiberiaLibyaLithuaniaLow & middle incomeLow incomeLower middle incomeLuxembourgMacao SAR, ChinaMacedonia, FYRMadagascarMalawiMalaysiaMaldivesMaliMaltaMarshall IslandsMauritaniaMauritiusMexicoMicronesia, Fed. Sts.Middle East & North AfricaMiddle East & North Africa (excluding high income)Middle East & North Africa (IDA & IBRD countries)Middle incomeMoldovaMongoliaMontenegroMoroccoMozambiqueMyanmarNamibiaNauruNepalNetherlandsNew CaledoniaNew ZealandNicaraguaNigerNigeriaNorth AmericaNorthern Mariana IslandsNorwayOECD membersOmanOther small statesPacific island small statesPakistanPalauPanamaPapua New GuineaParaguayPeruPhilippinesPolandPortugalPost-demographic dividendPre-demographic dividendQatarRomaniaRussian FederationRwandaSamoaSao Tome and PrincipeSaudi ArabiaSenegalSerbiaSeychellesSierra LeoneSingaporeSint Maarten (Dutch part)Slovak RepublicSloveniaSmall statesSolomon IslandsSomaliaSouth AfricaSouth AsiaSouth Asia (IDA & IBRD)South SudanSpainSri LankaSt. Kitts and NevisSt. LuciaSt. Vincent and the GrenadinesSub-Saharan Africa Sub-Saharan Africa (excluding high income)Sub-Saharan Africa (IDA & IBRD countries)SudanSurinameSwazilandSwedenSwitzerlandSyrian Arab RepublicTajikistanTanzaniaThailandTimor-LesteTogoTongaTrinidad and TobagoTunisiaTurkeyTurkmenistanTuvaluUgandaUkraineUnited Arab EmiratesUnited KingdomUnited StatesUpper middle incomeUruguayUzbekistanVanuatuVenezuela, RBVietnamWest Bank and GazaWorldYemen, Rep.ZambiaZimbabwe La ligne de temps
Cette échelle de temps montre un graphique de 1975 année à 2016 année Togo. Les données jusqu'à 1974 année ne sont pas présentés. Quantité d'observations actuelles selon dates: 42.
Source (désignation):
Les indicateurs du développement mondiale
Source (organisation):
International Monetary Fund, Balance of Payments database, supplemented by data from the United Nations Conference on Trade and Development and official national sources.
Catégories:
Economy & Growth, Financial Sector, External Debt
Dernière mise à jour
23 avr. 2017
Les indicateurs de changement de valeurs selon les années
Minimum:
-44.328 mln.
1 janv. 1975
Maximum:
727.757 mln.
1 janv. 2012
Pour la date d''observation
Valeur
Changement absolu
Le changement par rapport à la valeur précédente
1 janv. 1975
-44.328 mln.
-44.328 mln.
0.0%
1 janv. 1976
5.212 mln.
+49.54 mln.
-111.76%
1 janv. 1977
5.625 mln.
+412.591 milles
7.92%
1 janv. 1978
11.259 mln.
+5.634 mln.
100.17%
1 janv. 1979
92.894 mln.
+81.635 mln.
725.09%
1 janv. 1980
52.585 mln.
-40.309 mln.
-43.39%
1 janv. 1981
42.735 mln.
-9.85 mln.
-18.73%
1 janv. 1982
10.194 mln.
-32.541 mln.
-76.15%
1 janv. 1983
16.132 mln.
+5.938 mln.
58.25%
1 janv. 1984
1.443 mln.
-14.688 mln.
-91.05%
1 janv. 1985
-9.937 mln.
-11.38 mln.
-788.48%
1 janv. 1986
16.276 mln.
+26.212 mln.
-263.79%
1 janv. 1987
6.113 mln.
-10.162 mln.
-62.44%
1 janv. 1988
7.151 mln.
+1.037 mln.
16.97%
1 janv. 1989
12.966 mln.
+5.816 mln.
81.33%
1 janv. 1990
9.169 mln.
-3.797 mln.
-29.29%
1 janv. 1991
18.24 mln.
+9.071 mln.
98.93%
1 janv. 1992
6.48 mln.
-11.76 mln.
-64.47%
1 janv. 1993
-13.11 mln.
-19.589 mln.
-302.31%
1 janv. 1994
-11.873 mln.
+1.237 mln.
-9.43%
1 janv. 1995
15.42 mln.
+27.293 mln.
-229.87%
1 janv. 1996
26.169 mln.
+10.749 mln.
69.71%
1 janv. 1997
17.308 mln.
-8.86 mln.
-33.86%
1 janv. 1998
21.0 mln.
+3.692 mln.
21.33%
1 janv. 1999
30.162 mln.
+9.162 mln.
43.63%
1 janv. 2000
42.555 mln.
+12.393 mln.
41.09%
1 janv. 2001
52.687 mln.
+10.132 mln.
23.81%
1 janv. 2002
72.554 mln.
+19.867 mln.
37.71%
1 janv. 2003
57.535 mln.
-15.019 mln.
-20.7%
1 janv. 2004
45.671 mln.
-11.864 mln.
-20.62%
1 janv. 2005
79.824 mln.
+34.153 mln.
74.78%
1 janv. 2006
95.965 mln.
+16.141 mln.
20.22%
1 janv. 2007
91.316 mln.
-4.65 mln.
-4.85%
1 janv. 2008
62.324 mln.
-28.991 mln.
-31.75%
1 janv. 2009
50.687 mln.
-11.637 mln.
-18.67%
1 janv. 2010
46.119 mln.
-4.568 mln.
-9.01%
1 janv. 2011
124.942 mln.
+78.823 mln.
170.91%
1 janv. 2012
727.757 mln.
+602.815 mln.
482.48%
1 janv. 2013
121.519 mln.
-606.239 mln.
-83.3%
1 janv. 2014
195.755 mln.
+74.236 mln.
61.09%
1 janv. 2015
64.061 mln.
-131.693 mln.
-67.27%
1 janv. 2016
52.654 mln.
-11.408 mln.
-17.81%
Classement des pays selon les statistiques actuelles par années


Commentaires: