29
/fr/
fr
AIzaSyAYiBZKx7MnpbEhh9jyipgxe19OcubqV5w
April 1, 2024
275672
United Kingdom
GBR
true
2
1
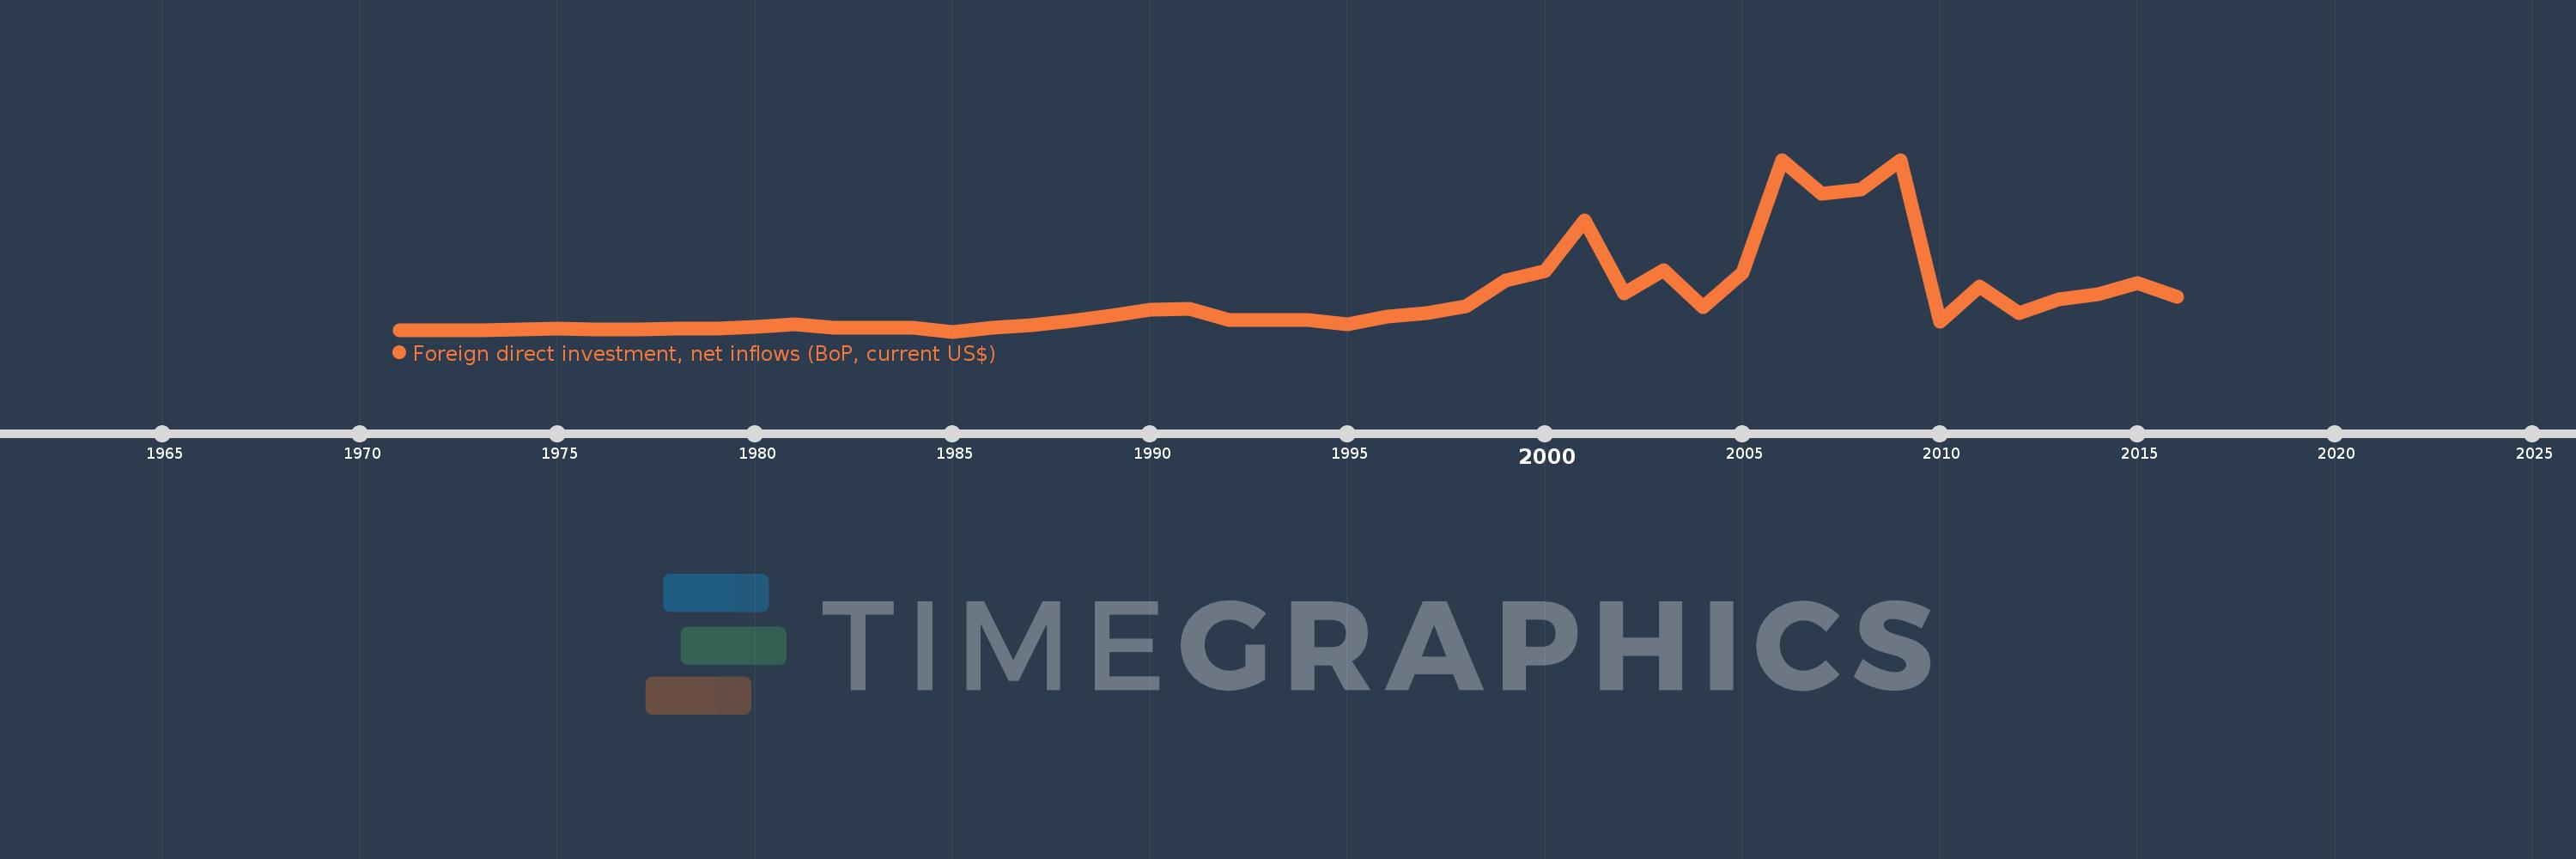
Foreign direct investment, net inflows (BoP, current US$)
2016,2015,2014,2013,2012,2011,2010,2009,2008,2007,2006,2005,2004,2003,2002,2001,2000,1999,1998,1997,1996,1995,1994,1993,1992,1991,1990,1989,1988,1987,1986,1985,1984,1983,1982,1981,1980,1979,1978,1977,1976,1975,1974,1973,1972,1971
Cette statistique dans les autres pays:
AfghanistanAlbaniaAlgeriaAngolaAntigua and BarbudaArab WorldArgentinaArmeniaArubaAustraliaAustriaAzerbaijanBahamas, TheBahrainBangladeshBarbadosBelarusBelgiumBelizeBeninBermudaBhutanBoliviaBosnia and HerzegovinaBotswanaBrazilBritish Virgin IslandsBrunei DarussalamBulgariaBurkina FasoBurundiCabo VerdeCambodiaCameroonCanadaCaribbean small statesCayman IslandsCentral African RepublicCentral Europe and the BalticsChadChileChinaColombiaComorosCongo, Dem. Rep.Congo, Rep.Costa RicaCote d'IvoireCroatiaCuracaoCyprusCzech RepublicDenmarkDjiboutiDominicaDominican RepublicEarly-demographic dividendEast Asia & PacificEast Asia & Pacific (excluding high income)East Asia & Pacific (IDA & IBRD countries)EcuadorEgypt, Arab Rep.El SalvadorEquatorial GuineaEritreaEstoniaEthiopiaEuro areaEurope & Central AsiaEurope & Central Asia (excluding high income)Europe & Central Asia (IDA & IBRD countries)European UnionFijiFinlandFragile and conflict affected situationsFranceFrench PolynesiaGabonGambia, TheGeorgiaGermanyGhanaGibraltarGreeceGrenadaGuatemalaGuineaGuinea-BissauGuyanaHaitiHeavily indebted poor countries (HIPC)High incomeHondurasHong Kong SAR, ChinaHungaryIBRD onlyIcelandIDA & IBRD totalIDA blendIDA onlyIDA totalIndiaIndonesiaIran, Islamic Rep.IraqIrelandIsraelItalyJamaicaJapanJordanKazakhstanKenyaKiribatiKorea, Dem. People’s Rep.Korea, Rep.KosovoKuwaitKyrgyz RepublicLao PDRLate-demographic dividendLatin America & Caribbean Latin America & Caribbean (excluding high income)Latin America & the Caribbean (IDA & IBRD countries)LatviaLeast developed countries: UN classificationLebanonLesothoLiberiaLibyaLithuaniaLow & middle incomeLow incomeLower middle incomeLuxembourgMacao SAR, ChinaMacedonia, FYRMadagascarMalawiMalaysiaMaldivesMaliMaltaMarshall IslandsMauritaniaMauritiusMexicoMicronesia, Fed. Sts.Middle East & North AfricaMiddle East & North Africa (excluding high income)Middle East & North Africa (IDA & IBRD countries)Middle incomeMoldovaMongoliaMontenegroMoroccoMozambiqueMyanmarNamibiaNauruNepalNetherlandsNew CaledoniaNew ZealandNicaraguaNigerNigeriaNorth AmericaNorthern Mariana IslandsNorwayOECD membersOmanOther small statesPacific island small statesPakistanPalauPanamaPapua New GuineaParaguayPeruPhilippinesPolandPortugalPost-demographic dividendPre-demographic dividendQatarRomaniaRussian FederationRwandaSamoaSao Tome and PrincipeSaudi ArabiaSenegalSerbiaSeychellesSierra LeoneSingaporeSint Maarten (Dutch part)Slovak RepublicSloveniaSmall statesSolomon IslandsSomaliaSouth AfricaSouth AsiaSouth Asia (IDA & IBRD)South SudanSpainSri LankaSt. Kitts and NevisSt. LuciaSt. Vincent and the GrenadinesSub-Saharan Africa Sub-Saharan Africa (excluding high income)Sub-Saharan Africa (IDA & IBRD countries)SudanSurinameSwazilandSwedenSwitzerlandSyrian Arab RepublicTajikistanTanzaniaThailandTimor-LesteTogoTongaTrinidad and TobagoTunisiaTurkeyTurkmenistanTuvaluUgandaUkraineUnited Arab EmiratesUnited KingdomUnited StatesUpper middle incomeUruguayUzbekistanVanuatuVenezuela, RBVietnamWest Bank and GazaWorldYemen, Rep.ZambiaZimbabwe La ligne de temps
Cette échelle de temps montre un graphique de 1971 année à 2016 année United Kingdom. Les données jusqu'à 1970 année ne sont pas présentés. Quantité d'observations actuelles selon dates: 46.
Source (désignation):
Les indicateurs du développement mondiale
Source (organisation):
International Monetary Fund, Balance of Payments database, supplemented by data from the United Nations Conference on Trade and Development and official national sources.
Catégories:
Economy & Growth, Financial Sector, External Debt
Dernière mise à jour
23 avr. 2017
Les indicateurs de changement de valeurs selon les années
Minimum:
-347.323 mln.
1 janv. 1985
Maximum:
253.454 mds
1 janv. 2009
Pour la date d''observation
Valeur
Changement absolu
Le changement par rapport à la valeur précédente
1 janv. 1971
1.488 mds
+1.488 mds
0.0%
1 janv. 1972
1.771 mds
+283.226 mln.
19.03%
1 janv. 1973
1.208 mds
-563.261 mln.
-31.8%
1 janv. 1974
2.723 mds
+1.515 mds
125.4%
1 janv. 1975
4.374 mds
+1.651 mds
60.64%
1 janv. 1976
3.319 mds
-1.055 mds
-24.13%
1 janv. 1977
3.006 mds
-312.328 mln.
-9.41%
1 janv. 1978
4.427 mds
+1.42 mds
47.25%
1 janv. 1979
3.787 mds
-639.175 mln.
-14.44%
1 janv. 1980
6.469 mds
+2.682 mds
70.82%
1 janv. 1981
10.123 mds
+3.653 mds
56.47%
1 janv. 1982
5.879 mds
-4.243 mds
-41.92%
1 janv. 1983
5.413 mds
-466.116 mln.
-7.93%
1 janv. 1984
5.179 mds
-234.478 mln.
-4.33%
1 janv. 1985
-347.323 mln.
-5.526 mds
-106.71%
1 janv. 1986
5.476 mds
+5.824 mds
-1.68 milles%
1 janv. 1987
8.57 mds
+3.093 mds
56.48%
1 janv. 1988
15.921 mds
+7.352 mds
85.79%
1 janv. 1989
22.568 mds
+6.646 mds
41.74%
1 janv. 1990
31.65 mds
+9.083 mds
40.25%
1 janv. 1991
33.504 mds
+1.854 mds
5.86%
1 janv. 1992
16.451 mds
-17.052 mds
-50.9%
1 janv. 1993
16.559 mds
+107.459 mln.
0.65%
1 janv. 1994
16.518 mds
-40.737 mln.
-0.25%
1 janv. 1995
10.725 mds
-5.793 mds
-35.07%
1 janv. 1996
21.731 mds
+11.006 mds
102.62%
1 janv. 1997
27.39 mds
+5.659 mds
26.04%
1 janv. 1998
37.505 mds
+10.115 mds
36.93%
1 janv. 1999
74.652 mds
+37.146 mds
99.04%
1 janv. 2000
89.337 mds
+14.685 mds
19.67%
1 janv. 2001
164.13 mds
+74.793 mds
83.72%
1 janv. 2002
56.091 mds
-108.039 mds
-65.83%
1 janv. 2003
89.761 mds
+33.67 mds
60.03%
1 janv. 2004
36.011 mds
-53.749 mds
-59.88%
1 janv. 2005
87.06 mds
+51.048 mds
141.76%
1 janv. 2006
252.653 mds
+165.594 mds
190.21%
1 janv. 2007
203.636 mds
-49.017 mds
-19.4%
1 janv. 2008
209.515 mds
+5.879 mds
2.89%
1 janv. 2009
253.454 mds
+43.939 mds
20.97%
1 janv. 2010
14.547 mds
-238.907 mds
-94.26%
1 janv. 2011
66.735 mds
+52.187 mds
358.75%
1 janv. 2012
27.012 mds
-39.723 mds
-59.52%
1 janv. 2013
46.751 mds
+19.739 mds
73.07%
1 janv. 2014
54.473 mds
+7.722 mds
16.52%
1 janv. 2015
71.364 mds
+16.891 mds
31.01%
1 janv. 2016
50.439 mds
-20.926 mds
-29.32%
Classement des pays selon les statistiques actuelles par années


Commentaires: