29
/fr/
fr
AIzaSyAYiBZKx7MnpbEhh9jyipgxe19OcubqV5w
April 1, 2024
145653
Guinea
GIN
true
2
1
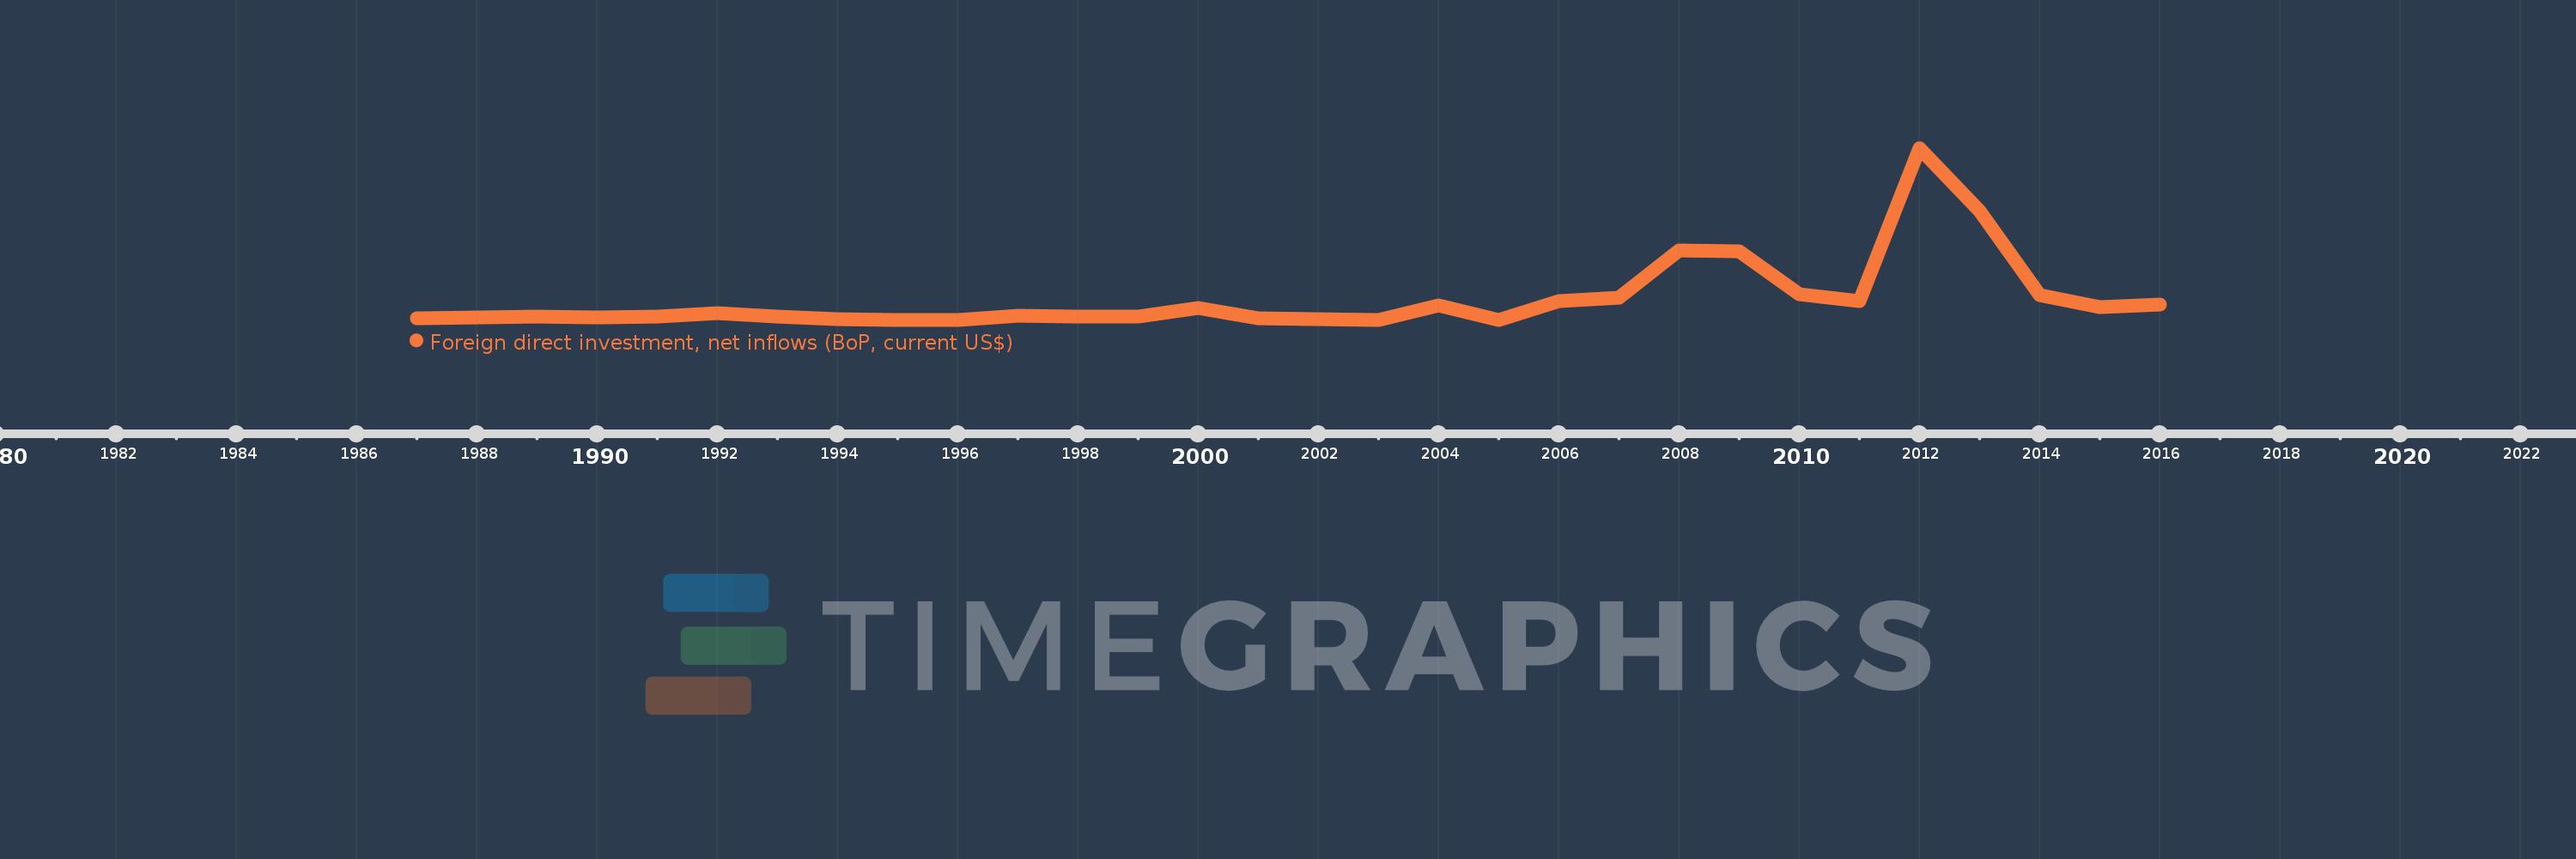
Foreign direct investment, net inflows (BoP, current US$)
2016,2015,2014,2013,2012,2011,2010,2009,2008,2007,2006,2005,2004,2003,2002,2001,2000,1999,1998,1997,1996,1995,1994,1993,1992,1991,1990,1989,1988,1987
Cette statistique dans les autres pays:
AfghanistanAlbaniaAlgeriaAngolaAntigua and BarbudaArab WorldArgentinaArmeniaArubaAustraliaAustriaAzerbaijanBahamas, TheBahrainBangladeshBarbadosBelarusBelgiumBelizeBeninBermudaBhutanBoliviaBosnia and HerzegovinaBotswanaBrazilBritish Virgin IslandsBrunei DarussalamBulgariaBurkina FasoBurundiCabo VerdeCambodiaCameroonCanadaCaribbean small statesCayman IslandsCentral African RepublicCentral Europe and the BalticsChadChileChinaColombiaComorosCongo, Dem. Rep.Congo, Rep.Costa RicaCote d'IvoireCroatiaCuracaoCyprusCzech RepublicDenmarkDjiboutiDominicaDominican RepublicEarly-demographic dividendEast Asia & PacificEast Asia & Pacific (excluding high income)East Asia & Pacific (IDA & IBRD countries)EcuadorEgypt, Arab Rep.El SalvadorEquatorial GuineaEritreaEstoniaEthiopiaEuro areaEurope & Central AsiaEurope & Central Asia (excluding high income)Europe & Central Asia (IDA & IBRD countries)European UnionFijiFinlandFragile and conflict affected situationsFranceFrench PolynesiaGabonGambia, TheGeorgiaGermanyGhanaGibraltarGreeceGrenadaGuatemalaGuineaGuinea-BissauGuyanaHaitiHeavily indebted poor countries (HIPC)High incomeHondurasHong Kong SAR, ChinaHungaryIBRD onlyIcelandIDA & IBRD totalIDA blendIDA onlyIDA totalIndiaIndonesiaIran, Islamic Rep.IraqIrelandIsraelItalyJamaicaJapanJordanKazakhstanKenyaKiribatiKorea, Dem. People’s Rep.Korea, Rep.KosovoKuwaitKyrgyz RepublicLao PDRLate-demographic dividendLatin America & Caribbean Latin America & Caribbean (excluding high income)Latin America & the Caribbean (IDA & IBRD countries)LatviaLeast developed countries: UN classificationLebanonLesothoLiberiaLibyaLithuaniaLow & middle incomeLow incomeLower middle incomeLuxembourgMacao SAR, ChinaMacedonia, FYRMadagascarMalawiMalaysiaMaldivesMaliMaltaMarshall IslandsMauritaniaMauritiusMexicoMicronesia, Fed. Sts.Middle East & North AfricaMiddle East & North Africa (excluding high income)Middle East & North Africa (IDA & IBRD countries)Middle incomeMoldovaMongoliaMontenegroMoroccoMozambiqueMyanmarNamibiaNauruNepalNetherlandsNew CaledoniaNew ZealandNicaraguaNigerNigeriaNorth AmericaNorthern Mariana IslandsNorwayOECD membersOmanOther small statesPacific island small statesPakistanPalauPanamaPapua New GuineaParaguayPeruPhilippinesPolandPortugalPost-demographic dividendPre-demographic dividendQatarRomaniaRussian FederationRwandaSamoaSao Tome and PrincipeSaudi ArabiaSenegalSerbiaSeychellesSierra LeoneSingaporeSint Maarten (Dutch part)Slovak RepublicSloveniaSmall statesSolomon IslandsSomaliaSouth AfricaSouth AsiaSouth Asia (IDA & IBRD)South SudanSpainSri LankaSt. Kitts and NevisSt. LuciaSt. Vincent and the GrenadinesSub-Saharan Africa Sub-Saharan Africa (excluding high income)Sub-Saharan Africa (IDA & IBRD countries)SudanSurinameSwazilandSwedenSwitzerlandSyrian Arab RepublicTajikistanTanzaniaThailandTimor-LesteTogoTongaTrinidad and TobagoTunisiaTurkeyTurkmenistanTuvaluUgandaUkraineUnited Arab EmiratesUnited KingdomUnited StatesUpper middle incomeUruguayUzbekistanVanuatuVenezuela, RBVietnamWest Bank and GazaWorldYemen, Rep.ZambiaZimbabwe La ligne de temps
Cette échelle de temps montre un graphique de 1987 année à 2016 année Guinea. Les données jusqu'à 1986 année ne sont pas présentés. Quantité d'observations actuelles selon dates: 30.
Source (désignation):
Les indicateurs du développement mondiale
Source (organisation):
International Monetary Fund, Balance of Payments database, supplemented by data from the United Nations Conference on Trade and Development and official national sources.
Catégories:
Economy & Growth, Financial Sector, External Debt
Dernière mise à jour
23 avr. 2017
Les indicateurs de changement de valeurs selon les années
Maximum:
956.04 mln.
1 janv. 2012
Pour la date d''observation
Valeur
Changement absolu
Le changement par rapport à la valeur précédente
1 janv. 1987
8.4 mln.
+8.4 mln.
0.0%
1 janv. 1988
12.85 mln.
+4.45 mln.
52.98%
1 janv. 1989
15.68 mln.
+2.83 mln.
22.02%
1 janv. 1990
12.33 mln.
-3.35 mln.
-21.36%
1 janv. 1991
17.86 mln.
+5.53 mln.
44.85%
1 janv. 1992
38.77 mln.
+20.91 mln.
117.08%
1 janv. 1993
19.69 mln.
-19.08 mln.
-49.21%
1 janv. 1994
2.72 mln.
-16.97 mln.
-86.19%
1 janv. 1995
210.0 milles
-2.51 mln.
-92.28%
1 janv. 1996
769.0 milles
+559.0 milles
266.19%
1 janv. 1997
23.774 mln.
+23.005 mln.
2.99 milles%
1 janv. 1998
17.301 mln.
-6.473 mln.
-27.23%
1 janv. 1999
17.81 mln.
+509.0 milles
2.94%
1 janv. 2000
63.452 mln.
+45.642 mln.
256.27%
1 janv. 2001
9.942 mln.
-53.51 mln.
-84.33%
1 janv. 2002
1.677 mln.
-8.265 mln.
-83.13%
1 janv. 2003
0.0
-1.677 mln.
-100.0%
1 janv. 2004
78.966 mln.
+78.966 mln.
%
1 janv. 2005
0.0
-78.966 mln.
-100.0%
1 janv. 2006
105.0 mln.
+105.0 mln.
%
1 janv. 2007
125.0 mln.
+20.0 mln.
19.05%
1 janv. 2008
385.9 mln.
+260.9 mln.
208.72%
1 janv. 2009
381.88 mln.
-4.02 mln.
-1.04%
1 janv. 2010
140.85 mln.
-241.03 mln.
-63.12%
1 janv. 2011
101.35 mln.
-39.5 mln.
-28.04%
1 janv. 2012
956.04 mln.
+854.69 mln.
843.31%
1 janv. 2013
605.4 mln.
-350.64 mln.
-36.68%
1 janv. 2014
135.33 mln.
-470.07 mln.
-77.65%
1 janv. 2015
68.0 mln.
-67.33 mln.
-49.75%
1 janv. 2016
85.0 mln.
+17.0 mln.
25.0%
Classement des pays selon les statistiques actuelles par années


Commentaires: