29
/fr/
fr
AIzaSyAYiBZKx7MnpbEhh9jyipgxe19OcubqV5w
April 1, 2024
222166
Peru
PER
true
2
1
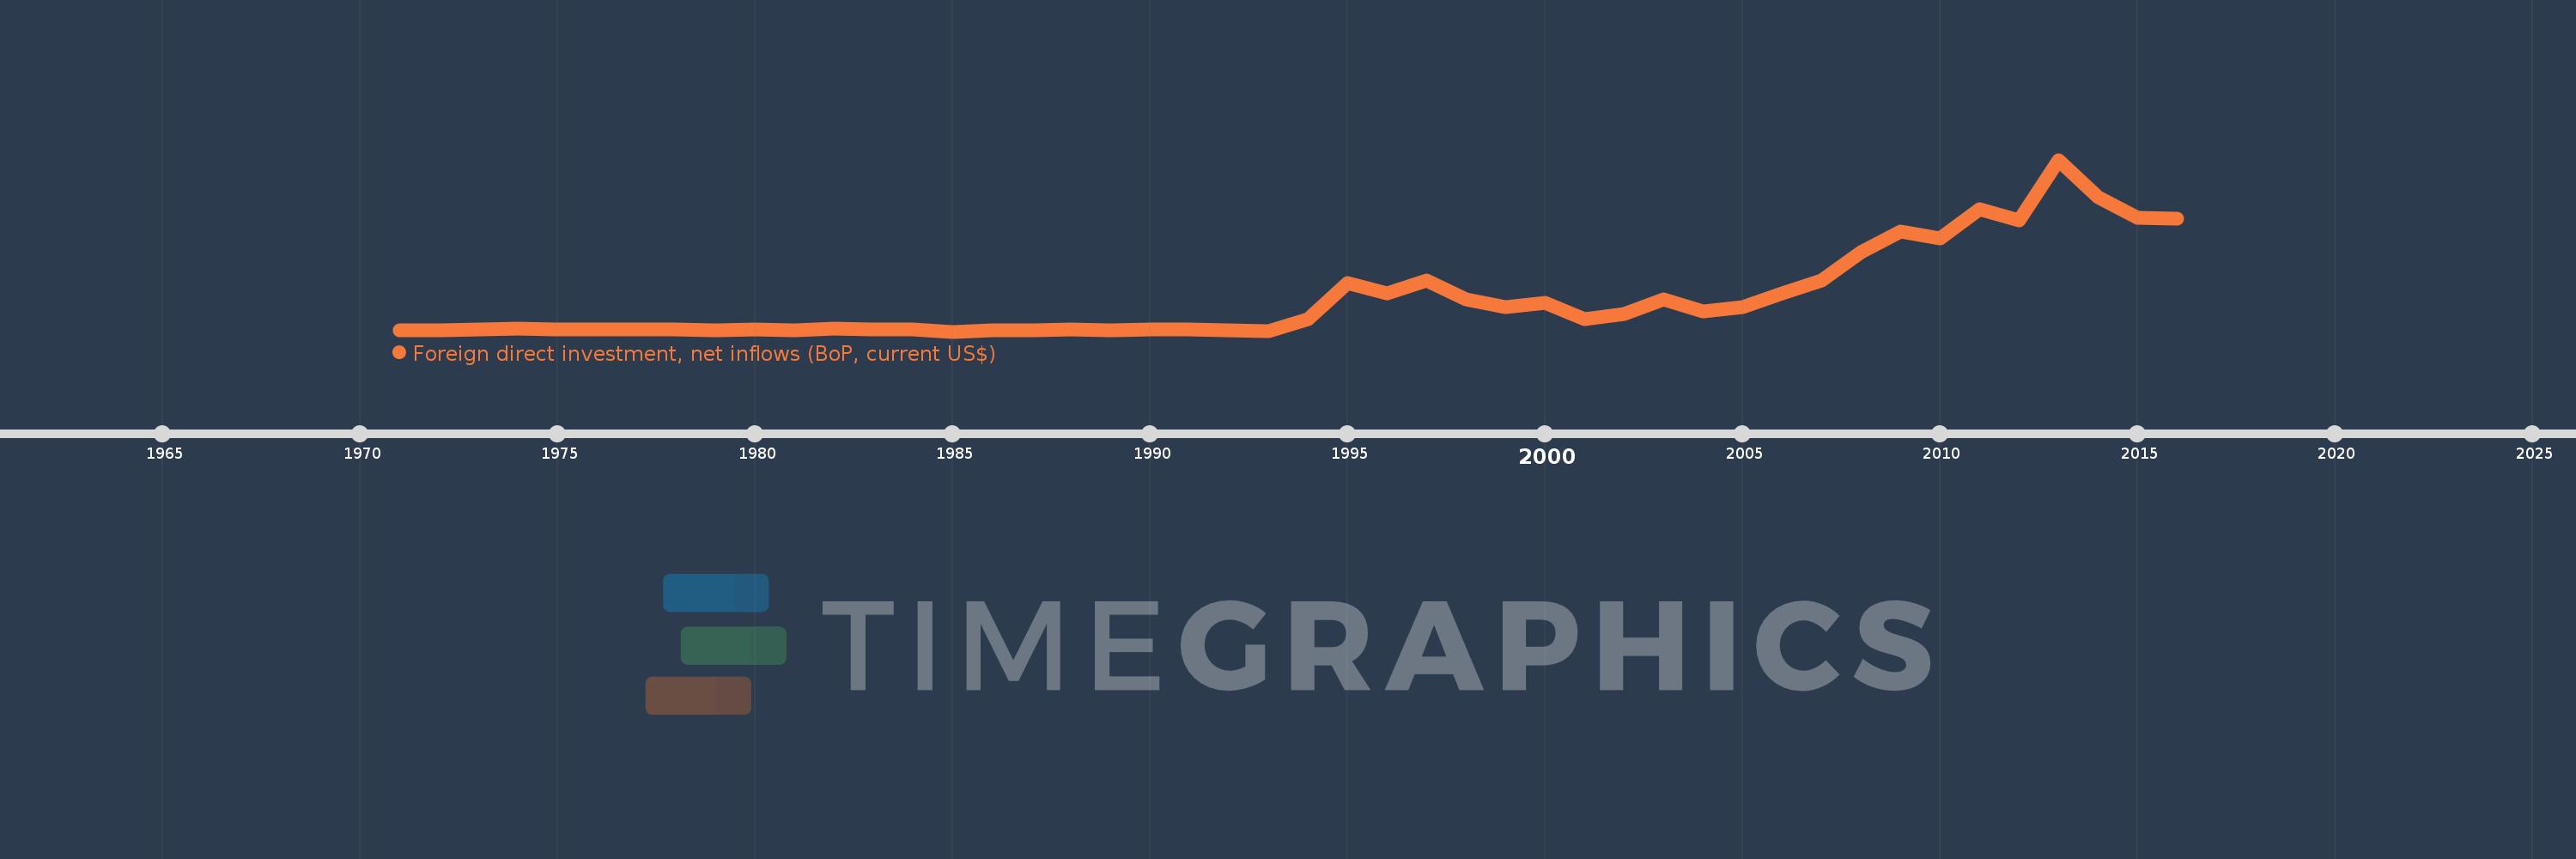
Foreign direct investment, net inflows (BoP, current US$)
2016,2015,2014,2013,2012,2011,2010,2009,2008,2007,2006,2005,2004,2003,2002,2001,2000,1999,1998,1997,1996,1995,1994,1993,1992,1991,1990,1989,1988,1987,1986,1985,1984,1983,1982,1981,1980,1979,1978,1977,1976,1975,1974,1973,1972,1971
Cette statistique dans les autres pays:
AfghanistanAlbaniaAlgeriaAngolaAntigua and BarbudaArab WorldArgentinaArmeniaArubaAustraliaAustriaAzerbaijanBahamas, TheBahrainBangladeshBarbadosBelarusBelgiumBelizeBeninBermudaBhutanBoliviaBosnia and HerzegovinaBotswanaBrazilBritish Virgin IslandsBrunei DarussalamBulgariaBurkina FasoBurundiCabo VerdeCambodiaCameroonCanadaCaribbean small statesCayman IslandsCentral African RepublicCentral Europe and the BalticsChadChileChinaColombiaComorosCongo, Dem. Rep.Congo, Rep.Costa RicaCote d'IvoireCroatiaCuracaoCyprusCzech RepublicDenmarkDjiboutiDominicaDominican RepublicEarly-demographic dividendEast Asia & PacificEast Asia & Pacific (excluding high income)East Asia & Pacific (IDA & IBRD countries)EcuadorEgypt, Arab Rep.El SalvadorEquatorial GuineaEritreaEstoniaEthiopiaEuro areaEurope & Central AsiaEurope & Central Asia (excluding high income)Europe & Central Asia (IDA & IBRD countries)European UnionFijiFinlandFragile and conflict affected situationsFranceFrench PolynesiaGabonGambia, TheGeorgiaGermanyGhanaGibraltarGreeceGrenadaGuatemalaGuineaGuinea-BissauGuyanaHaitiHeavily indebted poor countries (HIPC)High incomeHondurasHong Kong SAR, ChinaHungaryIBRD onlyIcelandIDA & IBRD totalIDA blendIDA onlyIDA totalIndiaIndonesiaIran, Islamic Rep.IraqIrelandIsraelItalyJamaicaJapanJordanKazakhstanKenyaKiribatiKorea, Dem. People’s Rep.Korea, Rep.KosovoKuwaitKyrgyz RepublicLao PDRLate-demographic dividendLatin America & Caribbean Latin America & Caribbean (excluding high income)Latin America & the Caribbean (IDA & IBRD countries)LatviaLeast developed countries: UN classificationLebanonLesothoLiberiaLibyaLithuaniaLow & middle incomeLow incomeLower middle incomeLuxembourgMacao SAR, ChinaMacedonia, FYRMadagascarMalawiMalaysiaMaldivesMaliMaltaMarshall IslandsMauritaniaMauritiusMexicoMicronesia, Fed. Sts.Middle East & North AfricaMiddle East & North Africa (excluding high income)Middle East & North Africa (IDA & IBRD countries)Middle incomeMoldovaMongoliaMontenegroMoroccoMozambiqueMyanmarNamibiaNauruNepalNetherlandsNew CaledoniaNew ZealandNicaraguaNigerNigeriaNorth AmericaNorthern Mariana IslandsNorwayOECD membersOmanOther small statesPacific island small statesPakistanPalauPanamaPapua New GuineaParaguayPeruPhilippinesPolandPortugalPost-demographic dividendPre-demographic dividendQatarRomaniaRussian FederationRwandaSamoaSao Tome and PrincipeSaudi ArabiaSenegalSerbiaSeychellesSierra LeoneSingaporeSint Maarten (Dutch part)Slovak RepublicSloveniaSmall statesSolomon IslandsSomaliaSouth AfricaSouth AsiaSouth Asia (IDA & IBRD)South SudanSpainSri LankaSt. Kitts and NevisSt. LuciaSt. Vincent and the GrenadinesSub-Saharan Africa Sub-Saharan Africa (excluding high income)Sub-Saharan Africa (IDA & IBRD countries)SudanSurinameSwazilandSwedenSwitzerlandSyrian Arab RepublicTajikistanTanzaniaThailandTimor-LesteTogoTongaTrinidad and TobagoTunisiaTurkeyTurkmenistanTuvaluUgandaUkraineUnited Arab EmiratesUnited KingdomUnited StatesUpper middle incomeUruguayUzbekistanVanuatuVenezuela, RBVietnamWest Bank and GazaWorldYemen, Rep.ZambiaZimbabwe La ligne de temps
Cette échelle de temps montre un graphique de 1971 année à 2016 année Peru. Les données jusqu'à 1970 année ne sont pas présentés. Quantité d'observations actuelles selon dates: 46.
Source (désignation):
Les indicateurs du développement mondiale
Source (organisation):
International Monetary Fund, Balance of Payments database, supplemented by data from the United Nations Conference on Trade and Development and official national sources.
Catégories:
Economy & Growth, Financial Sector, External Debt
Dernière mise à jour
23 avr. 2017
Les indicateurs de changement de valeurs selon les années
Minimum:
-89.0 mln.
1 janv. 1985
Maximum:
11.918 mds
1 janv. 2013
Pour la date d''observation
Valeur
Changement absolu
Le changement par rapport à la valeur précédente
1 janv. 1971
-13.96 mln.
-13.96 mln.
0.0%
1 janv. 1972
-3.22 mln.
+10.74 mln.
-76.93%
1 janv. 1973
60.313 mln.
+63.533 mln.
-1.97 milles%
1 janv. 1974
95.63 mln.
+35.317 mln.
58.56%
1 janv. 1975
62.372 mln.
-33.258 mln.
-34.78%
1 janv. 1976
81.105 mln.
+18.733 mln.
30.03%
1 janv. 1977
71.889 mln.
-9.216 mln.
-11.36%
1 janv. 1978
54.1 mln.
-17.789 mln.
-24.75%
1 janv. 1979
25.0 mln.
-29.1 mln.
-53.79%
1 janv. 1980
71.0 mln.
+46.0 mln.
184.0%
1 janv. 1981
26.9 mln.
-44.1 mln.
-62.11%
1 janv. 1982
125.0 mln.
+98.1 mln.
364.68%
1 janv. 1983
48.0 mln.
-77.0 mln.
-61.6%
1 janv. 1984
38.0 mln.
-10.0 mln.
-20.83%
1 janv. 1985
-89.0 mln.
-127.0 mln.
-334.21%
1 janv. 1986
1000.0 milles
+90.0 mln.
-101.12%
1 janv. 1987
22.0 mln.
+21.0 mln.
2.1 milles%
1 janv. 1988
32.0 mln.
+10.0 mln.
45.45%
1 janv. 1989
26.0 mln.
-6.0 mln.
-18.75%
1 janv. 1990
59.0 mln.
+33.0 mln.
126.92%
1 janv. 1991
41.0 mln.
-18.0 mln.
-30.51%
1 janv. 1992
-7.0 mln.
-48.0 mln.
-117.07%
1 janv. 1993
-79.0 mln.
-72.0 mln.
1.03 milles%
1 janv. 1994
760.589 mln.
+839.589 mln.
-1.06 milles%
1 janv. 1995
3.289 mds
+2.529 mds
332.45%
1 janv. 1996
2.557 mds
-732.205 mln.
-22.26%
1 janv. 1997
3.471 mds
+914.168 mln.
35.75%
1 janv. 1998
2.139 mds
-1.332 mds
-38.37%
1 janv. 1999
1.644 mds
-495.311 mln.
-23.15%
1 janv. 2000
1.94 mds
+296.06 mln.
18.01%
1 janv. 2001
809.697 mln.
-1.13 mds
-58.26%
1 janv. 2002
1.144 mds
+334.563 mln.
41.32%
1 janv. 2003
2.156 mds
+1.012 mds
88.4%
1 janv. 2004
1.335 mds
-820.83 mln.
-38.07%
1 janv. 2005
1.599 mds
+264.031 mln.
19.78%
1 janv. 2006
2.579 mds
+979.681 mln.
61.27%
1 janv. 2007
3.467 mds
+887.812 mln.
34.43%
1 janv. 2008
5.491 mds
+2.024 mds
58.4%
1 janv. 2009
6.924 mds
+1.433 mds
26.09%
1 janv. 2010
6.431 mds
-492.998 mln.
-7.12%
1 janv. 2011
8.455 mds
+2.024 mds
31.47%
1 janv. 2012
7.665 mds
-789.681 mln.
-9.34%
1 janv. 2013
11.918 mds
+4.253 mds
55.49%
1 janv. 2014
9.298 mds
-2.62 mds
-21.98%
1 janv. 2015
7.885 mds
-1.413 mds
-15.2%
1 janv. 2016
7.817 mds
-67.423 mln.
-0.86%
Classement des pays selon les statistiques actuelles par années


Commentaires: