29
/fr/
fr
AIzaSyAYiBZKx7MnpbEhh9jyipgxe19OcubqV5w
April 1, 2024
234623
Saudi Arabia
SAU
true
2
1
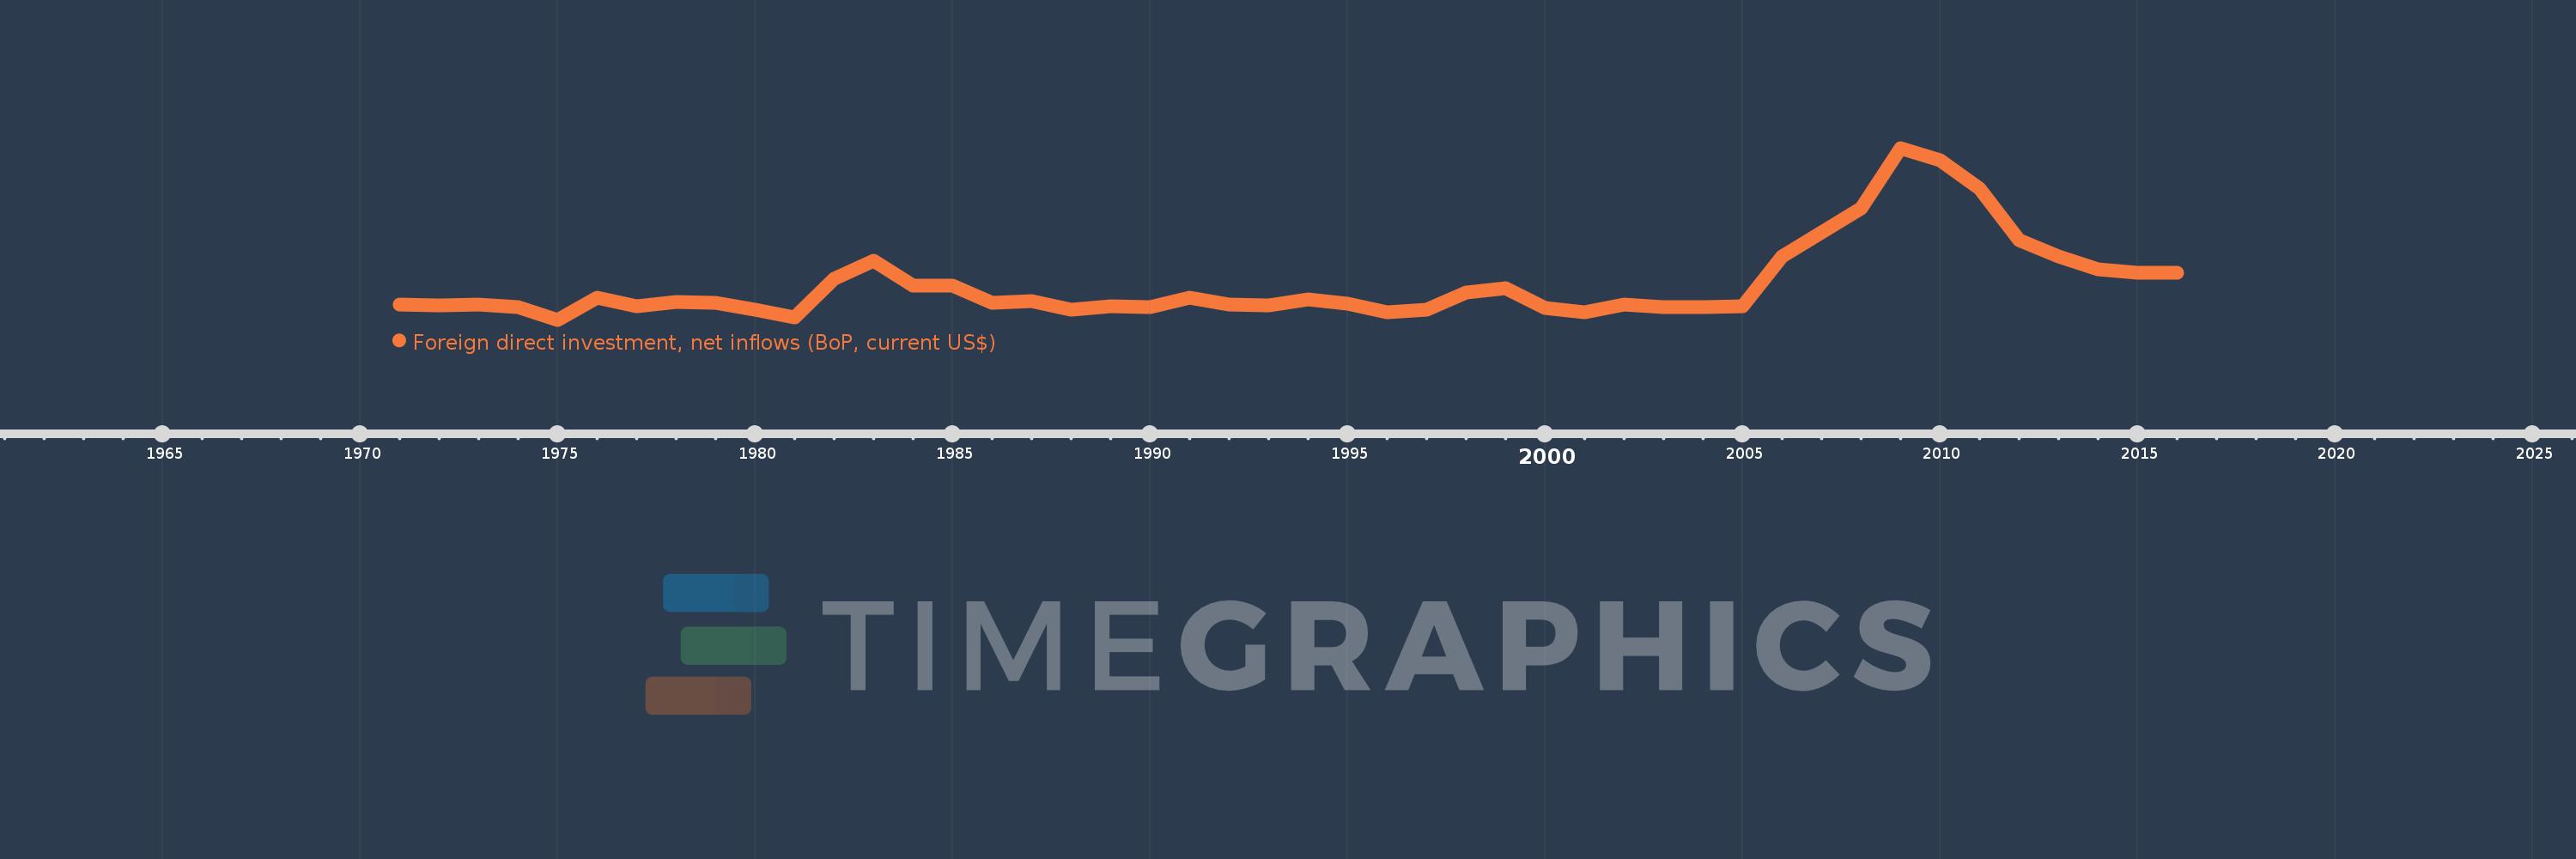
Foreign direct investment, net inflows (BoP, current US$)
2016,2015,2014,2013,2012,2011,2010,2009,2008,2007,2006,2005,2004,2003,2002,2001,2000,1999,1998,1997,1996,1995,1994,1993,1992,1991,1990,1989,1988,1987,1986,1985,1984,1983,1982,1981,1980,1979,1978,1977,1976,1975,1974,1973,1972,1971
Cette statistique dans les autres pays:
AfghanistanAlbaniaAlgeriaAngolaAntigua and BarbudaArab WorldArgentinaArmeniaArubaAustraliaAustriaAzerbaijanBahamas, TheBahrainBangladeshBarbadosBelarusBelgiumBelizeBeninBermudaBhutanBoliviaBosnia and HerzegovinaBotswanaBrazilBritish Virgin IslandsBrunei DarussalamBulgariaBurkina FasoBurundiCabo VerdeCambodiaCameroonCanadaCaribbean small statesCayman IslandsCentral African RepublicCentral Europe and the BalticsChadChileChinaColombiaComorosCongo, Dem. Rep.Congo, Rep.Costa RicaCote d'IvoireCroatiaCuracaoCyprusCzech RepublicDenmarkDjiboutiDominicaDominican RepublicEarly-demographic dividendEast Asia & PacificEast Asia & Pacific (excluding high income)East Asia & Pacific (IDA & IBRD countries)EcuadorEgypt, Arab Rep.El SalvadorEquatorial GuineaEritreaEstoniaEthiopiaEuro areaEurope & Central AsiaEurope & Central Asia (excluding high income)Europe & Central Asia (IDA & IBRD countries)European UnionFijiFinlandFragile and conflict affected situationsFranceFrench PolynesiaGabonGambia, TheGeorgiaGermanyGhanaGibraltarGreeceGrenadaGuatemalaGuineaGuinea-BissauGuyanaHaitiHeavily indebted poor countries (HIPC)High incomeHondurasHong Kong SAR, ChinaHungaryIBRD onlyIcelandIDA & IBRD totalIDA blendIDA onlyIDA totalIndiaIndonesiaIran, Islamic Rep.IraqIrelandIsraelItalyJamaicaJapanJordanKazakhstanKenyaKiribatiKorea, Dem. People’s Rep.Korea, Rep.KosovoKuwaitKyrgyz RepublicLao PDRLate-demographic dividendLatin America & Caribbean Latin America & Caribbean (excluding high income)Latin America & the Caribbean (IDA & IBRD countries)LatviaLeast developed countries: UN classificationLebanonLesothoLiberiaLibyaLithuaniaLow & middle incomeLow incomeLower middle incomeLuxembourgMacao SAR, ChinaMacedonia, FYRMadagascarMalawiMalaysiaMaldivesMaliMaltaMarshall IslandsMauritaniaMauritiusMexicoMicronesia, Fed. Sts.Middle East & North AfricaMiddle East & North Africa (excluding high income)Middle East & North Africa (IDA & IBRD countries)Middle incomeMoldovaMongoliaMontenegroMoroccoMozambiqueMyanmarNamibiaNauruNepalNetherlandsNew CaledoniaNew ZealandNicaraguaNigerNigeriaNorth AmericaNorthern Mariana IslandsNorwayOECD membersOmanOther small statesPacific island small statesPakistanPalauPanamaPapua New GuineaParaguayPeruPhilippinesPolandPortugalPost-demographic dividendPre-demographic dividendQatarRomaniaRussian FederationRwandaSamoaSao Tome and PrincipeSaudi ArabiaSenegalSerbiaSeychellesSierra LeoneSingaporeSint Maarten (Dutch part)Slovak RepublicSloveniaSmall statesSolomon IslandsSomaliaSouth AfricaSouth AsiaSouth Asia (IDA & IBRD)South SudanSpainSri LankaSt. Kitts and NevisSt. LuciaSt. Vincent and the GrenadinesSub-Saharan Africa Sub-Saharan Africa (excluding high income)Sub-Saharan Africa (IDA & IBRD countries)SudanSurinameSwazilandSwedenSwitzerlandSyrian Arab RepublicTajikistanTanzaniaThailandTimor-LesteTogoTongaTrinidad and TobagoTunisiaTurkeyTurkmenistanTuvaluUgandaUkraineUnited Arab EmiratesUnited KingdomUnited StatesUpper middle incomeUruguayUzbekistanVanuatuVenezuela, RBVietnamWest Bank and GazaWorldYemen, Rep.ZambiaZimbabwe La ligne de temps
Cette échelle de temps montre un graphique de 1971 année à 2016 année Saudi Arabia. Les données jusqu'à 1970 année ne sont pas présentés. Quantité d'observations actuelles selon dates: 46.
Source (désignation):
Les indicateurs du développement mondiale
Source (organisation):
International Monetary Fund, Balance of Payments database, supplemented by data from the United Nations Conference on Trade and Development and official national sources.
Catégories:
Economy & Growth, Financial Sector, External Debt
Dernière mise à jour
23 avr. 2017
Les indicateurs de changement de valeurs selon les années
Minimum:
-3.732 mds
1 janv. 1975
Maximum:
39.456 mds
1 janv. 2009
Pour la date d''observation
Valeur
Changement absolu
Le changement par rapport à la valeur précédente
1 janv. 1971
7.36 mln.
+7.36 mln.
0.0%
1 janv. 1972
-111.437 mln.
-118.797 mln.
-1.61 milles%
1 janv. 1973
33.778 mln.
+145.215 mln.
-130.31%
1 janv. 1974
-625.912 mln.
-659.69 mln.
-1.95 milles%
1 janv. 1975
-3.732 mds
-3.106 mds
496.31%
1 janv. 1976
1.865 mds
+5.597 mds
-149.97%
1 janv. 1977
-396.601 mln.
-2.262 mds
-121.27%
1 janv. 1978
782.964 mln.
+1.18 mds
-297.42%
1 janv. 1979
555.954 mln.
-227.01 mln.
-28.99%
1 janv. 1980
-1.271 mds
-1.826 mds
-328.53%
1 janv. 1981
-3.192 mds
-1.922 mds
151.26%
1 janv. 1982
6.498 mds
+9.69 mds
-303.56%
1 janv. 1983
11.128 mds
+4.63 mds
71.26%
1 janv. 1984
4.944 mds
-6.184 mds
-55.57%
1 janv. 1985
4.85 mds
-94.042 mln.
-1.9%
1 janv. 1986
491.423 mln.
-4.358 mds
-89.87%
1 janv. 1987
965.936 mln.
+474.513 mln.
96.56%
1 janv. 1988
-1.173 mds
-2.139 mds
-221.47%
1 janv. 1989
-328.0 mln.
+845.333 mln.
-72.05%
1 janv. 1990
-653.333 mln.
-325.333 mln.
99.19%
1 janv. 1991
1.861 mds
+2.515 mds
-384.9%
1 janv. 1992
160.0 mln.
-1.701 mds
-91.4%
1 janv. 1993
-78.933 mln.
-238.933 mln.
-149.33%
1 janv. 1994
1.367 mds
+1.446 mds
-1.83 milles%
1 janv. 1995
349.333 mln.
-1.018 mds
-74.45%
1 janv. 1996
-1.875 mds
-2.224 mds
-636.64%
1 janv. 1997
-1.127 mds
+747.2 mln.
-39.86%
1 janv. 1998
3.039 mds
+4.167 mds
-369.58%
1 janv. 1999
4.283 mds
+1.244 mds
40.93%
1 janv. 2000
-778.933 mln.
-5.062 mds
-118.18%
1 janv. 2001
-1.881 mds
-1.102 mds
141.49%
1 janv. 2002
19.64 mln.
+1.901 mds
-101.04%
1 janv. 2003
-614.133 mln.
-633.773 mln.
-3.23 milles%
1 janv. 2004
-586.507 mln.
+27.627 mln.
-4.5%
1 janv. 2005
-334.32 mln.
+252.187 mln.
-43.0%
1 janv. 2006
12.107 mds
+12.441 mds
-3.72 milles%
1 janv. 2007
18.318 mds
+6.211 mds
51.3%
1 janv. 2008
24.334 mds
+6.016 mds
32.84%
1 janv. 2009
39.456 mds
+15.122 mds
62.14%
1 janv. 2010
36.458 mds
-2.998 mds
-7.6%
1 janv. 2011
29.233 mds
-7.225 mds
-19.82%
1 janv. 2012
16.308 mds
-12.924 mds
-44.21%
1 janv. 2013
12.182 mds
-4.126 mds
-25.3%
1 janv. 2014
8.865 mds
-3.318 mds
-27.23%
1 janv. 2015
8.012 mds
-852.907 mln.
-9.62%
1 janv. 2016
8.141 mds
+129.24 mln.
1.61%
Classement des pays selon les statistiques actuelles par années


Commentaires: