29
/fr/
fr
AIzaSyAYiBZKx7MnpbEhh9jyipgxe19OcubqV5w
April 1, 2024
171685
Kuwait
KWT
true
2
1
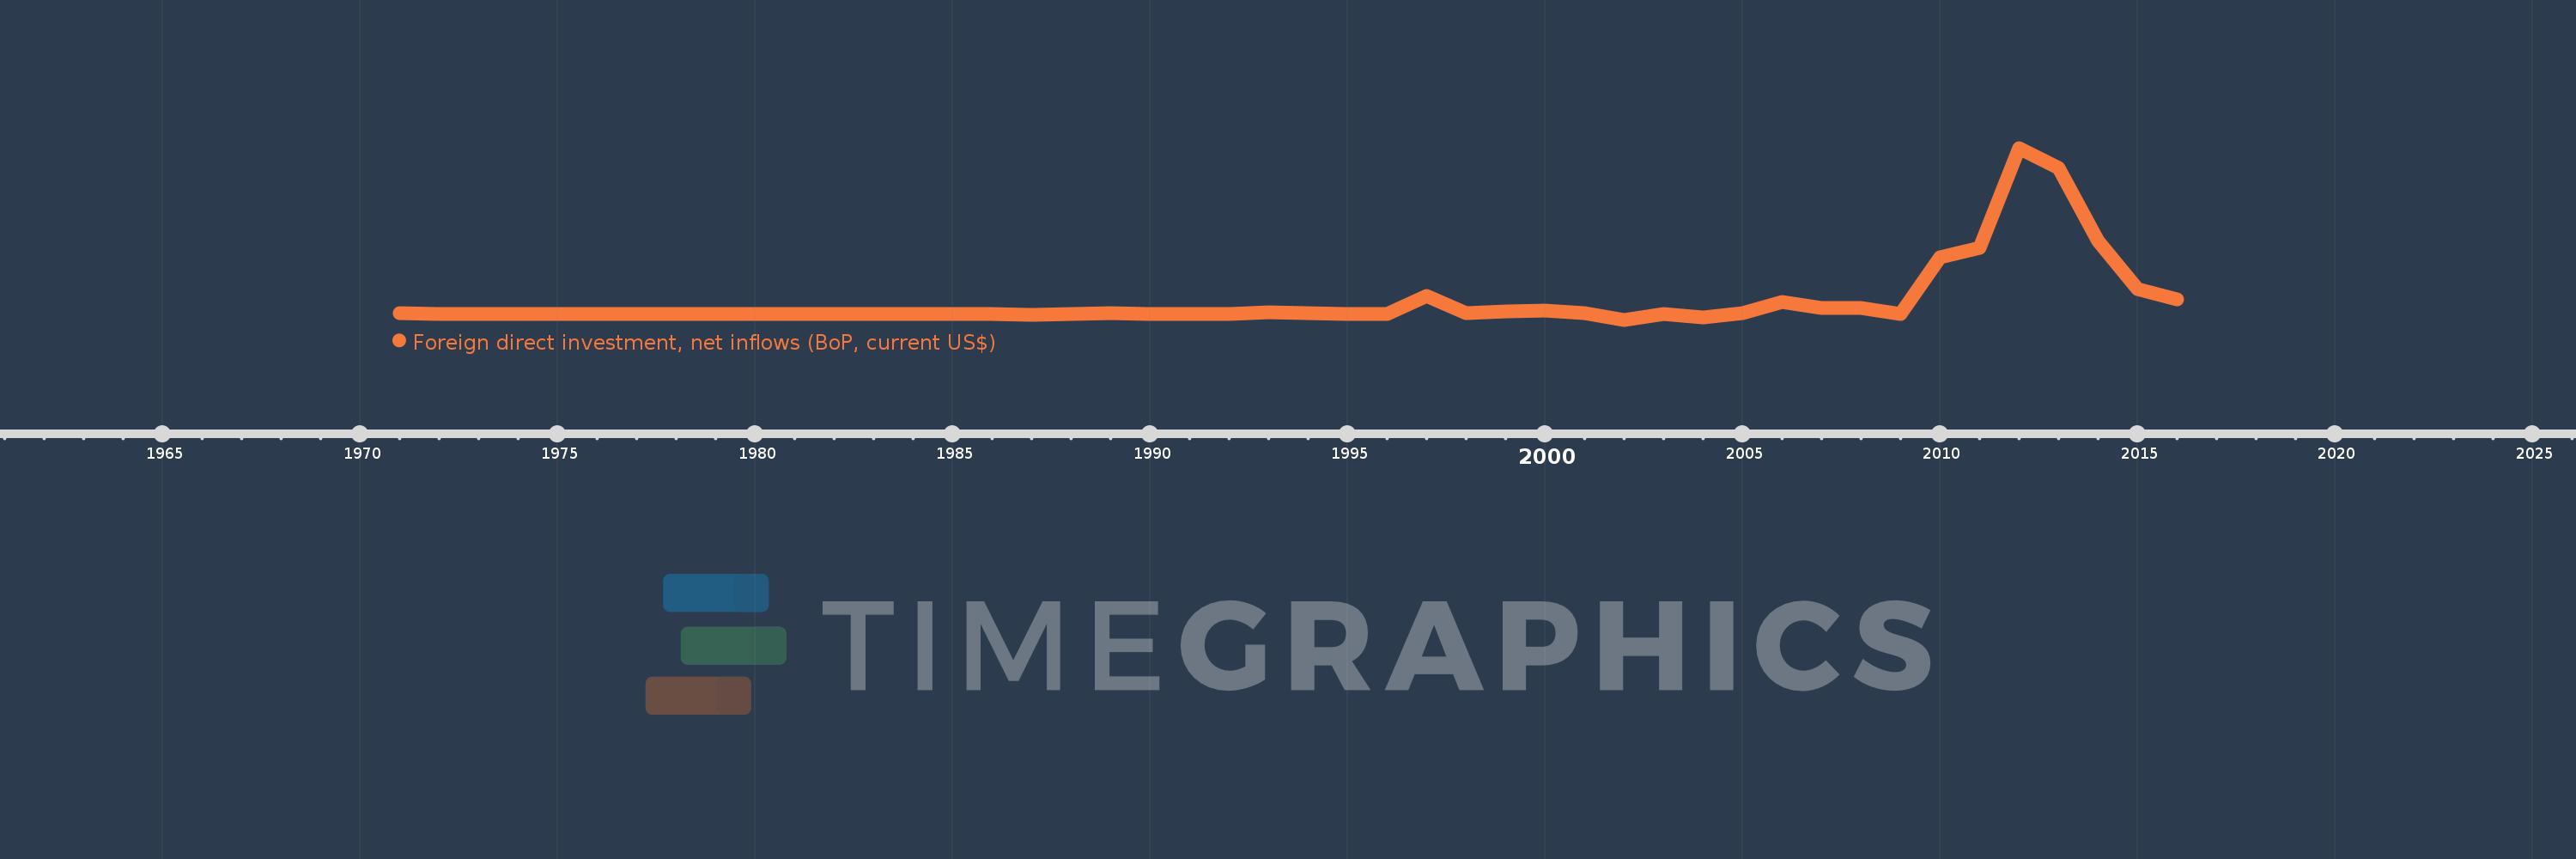
Foreign direct investment, net inflows (BoP, current US$)
2016,2015,2014,2013,2012,2011,2010,2009,2008,2007,2006,2005,2004,2003,2002,2001,2000,1999,1998,1997,1996,1995,1994,1993,1992,1991,1990,1989,1988,1987,1986,1985,1984,1983,1982,1981,1980,1979,1978,1977,1976,1975,1974,1973,1972,1971
Cette statistique dans les autres pays:
AfghanistanAlbaniaAlgeriaAngolaAntigua and BarbudaArab WorldArgentinaArmeniaArubaAustraliaAustriaAzerbaijanBahamas, TheBahrainBangladeshBarbadosBelarusBelgiumBelizeBeninBermudaBhutanBoliviaBosnia and HerzegovinaBotswanaBrazilBritish Virgin IslandsBrunei DarussalamBulgariaBurkina FasoBurundiCabo VerdeCambodiaCameroonCanadaCaribbean small statesCayman IslandsCentral African RepublicCentral Europe and the BalticsChadChileChinaColombiaComorosCongo, Dem. Rep.Congo, Rep.Costa RicaCote d'IvoireCroatiaCuracaoCyprusCzech RepublicDenmarkDjiboutiDominicaDominican RepublicEarly-demographic dividendEast Asia & PacificEast Asia & Pacific (excluding high income)East Asia & Pacific (IDA & IBRD countries)EcuadorEgypt, Arab Rep.El SalvadorEquatorial GuineaEritreaEstoniaEthiopiaEuro areaEurope & Central AsiaEurope & Central Asia (excluding high income)Europe & Central Asia (IDA & IBRD countries)European UnionFijiFinlandFragile and conflict affected situationsFranceFrench PolynesiaGabonGambia, TheGeorgiaGermanyGhanaGibraltarGreeceGrenadaGuatemalaGuineaGuinea-BissauGuyanaHaitiHeavily indebted poor countries (HIPC)High incomeHondurasHong Kong SAR, ChinaHungaryIBRD onlyIcelandIDA & IBRD totalIDA blendIDA onlyIDA totalIndiaIndonesiaIran, Islamic Rep.IraqIrelandIsraelItalyJamaicaJapanJordanKazakhstanKenyaKiribatiKorea, Dem. People’s Rep.Korea, Rep.KosovoKuwaitKyrgyz RepublicLao PDRLate-demographic dividendLatin America & Caribbean Latin America & Caribbean (excluding high income)Latin America & the Caribbean (IDA & IBRD countries)LatviaLeast developed countries: UN classificationLebanonLesothoLiberiaLibyaLithuaniaLow & middle incomeLow incomeLower middle incomeLuxembourgMacao SAR, ChinaMacedonia, FYRMadagascarMalawiMalaysiaMaldivesMaliMaltaMarshall IslandsMauritaniaMauritiusMexicoMicronesia, Fed. Sts.Middle East & North AfricaMiddle East & North Africa (excluding high income)Middle East & North Africa (IDA & IBRD countries)Middle incomeMoldovaMongoliaMontenegroMoroccoMozambiqueMyanmarNamibiaNauruNepalNetherlandsNew CaledoniaNew ZealandNicaraguaNigerNigeriaNorth AmericaNorthern Mariana IslandsNorwayOECD membersOmanOther small statesPacific island small statesPakistanPalauPanamaPapua New GuineaParaguayPeruPhilippinesPolandPortugalPost-demographic dividendPre-demographic dividendQatarRomaniaRussian FederationRwandaSamoaSao Tome and PrincipeSaudi ArabiaSenegalSerbiaSeychellesSierra LeoneSingaporeSint Maarten (Dutch part)Slovak RepublicSloveniaSmall statesSolomon IslandsSomaliaSouth AfricaSouth AsiaSouth Asia (IDA & IBRD)South SudanSpainSri LankaSt. Kitts and NevisSt. LuciaSt. Vincent and the GrenadinesSub-Saharan Africa Sub-Saharan Africa (excluding high income)Sub-Saharan Africa (IDA & IBRD countries)SudanSurinameSwazilandSwedenSwitzerlandSyrian Arab RepublicTajikistanTanzaniaThailandTimor-LesteTogoTongaTrinidad and TobagoTunisiaTurkeyTurkmenistanTuvaluUgandaUkraineUnited Arab EmiratesUnited KingdomUnited StatesUpper middle incomeUruguayUzbekistanVanuatuVenezuela, RBVietnamWest Bank and GazaWorldYemen, Rep.ZambiaZimbabwe La ligne de temps
Cette échelle de temps montre un graphique de 1971 année à 2016 année Kuwait. Les données jusqu'à 1970 année ne sont pas présentés. Quantité d'observations actuelles selon dates: 46.
Source (désignation):
Les indicateurs du développement mondiale
Source (organisation):
International Monetary Fund, Balance of Payments database, supplemented by data from the United Nations Conference on Trade and Development and official national sources.
Catégories:
Economy & Growth, Financial Sector, External Debt
Dernière mise à jour
23 avr. 2017
Les indicateurs de changement de valeurs selon les années
Minimum:
-111.516 mln.
1 janv. 2002
Maximum:
3.259 mds
1 janv. 2012
Pour la date d''observation
Valeur
Changement absolu
Le changement par rapport à la valeur précédente
1 janv. 1971
25.99 mln.
+25.99 mln.
0.0%
1 janv. 1972
10.0 milles
-25.98 mln.
-99.96%
1 janv. 1973
10.0 milles
0.0
0.0%
1 janv. 1974
300.0 milles
+290.0 milles
2.9 milles%
1 janv. 1975
120.0 milles
-180.0 milles
-60.0%
1 janv. 1976
250.0 milles
+130.0 milles
108.33%
1 janv. 1977
-510.0 milles
-760.0 milles
-304.0%
1 janv. 1978
1.33 mln.
+1.84 mln.
-360.78%
1 janv. 1979
760.0 milles
-570.0 milles
-42.86%
1 janv. 1980
1.28 mln.
+520.0 milles
68.42%
1 janv. 1981
830.0 milles
-450.0 milles
-35.16%
1 janv. 1982
1.21 mln.
+380.0 milles
45.78%
1 janv. 1983
-90.0 milles
-1.3 mln.
-107.44%
1 janv. 1984
40.0 milles
+130.0 milles
-144.44%
1 janv. 1985
-6.03 mln.
-6.07 mln.
-15.18 milles%
1 janv. 1986
7.25 mln.
+13.28 mln.
-220.23%
1 janv. 1987
-14.53 mln.
-21.78 mln.
-300.41%
1 janv. 1988
-6.32 mln.
+8.21 mln.
-56.5%
1 janv. 1989
16.32 mln.
+22.64 mln.
-358.23%
1 janv. 1990
3.66 mln.
-12.66 mln.
-77.57%
1 janv. 1991
5.6 mln.
+1.94 mln.
53.01%
1 janv. 1992
800.0 milles
-4.8 mln.
-85.71%
1 janv. 1993
35.3 mln.
+34.5 mln.
4.31 milles%
1 janv. 1994
13.252 mln.
-22.048 mln.
-62.46%
1 janv. 1995
10.0 milles
-13.242 mln.
-99.92%
1 janv. 1996
6.701 mln.
+6.691 mln.
66.91 milles%
1 janv. 1997
347.351 mln.
+340.65 mln.
5.08 milles%
1 janv. 1998
19.779 mln.
-327.572 mln.
-94.31%
1 janv. 1999
59.064 mln.
+39.285 mln.
198.62%
1 janv. 2000
72.27 mln.
+13.206 mln.
22.36%
1 janv. 2001
16.3 mln.
-55.97 mln.
-77.45%
1 janv. 2002
-111.516 mln.
-127.816 mln.
-784.16%
1 janv. 2003
3.619 mln.
+115.136 mln.
-103.25%
1 janv. 2004
-67.111 mln.
-70.731 mln.
-1.95 milles%
1 janv. 2005
23.753 mln.
+90.864 mln.
-135.39%
1 janv. 2006
233.904 mln.
+210.151 mln.
884.74%
1 janv. 2007
121.306 mln.
-112.599 mln.
-48.14%
1 janv. 2008
111.536 mln.
-9.77 mln.
-8.05%
1 janv. 2009
-5.952 mln.
-117.487 mln.
-105.34%
1 janv. 2010
1.114 mds
+1.12 mds
-18.81 milles%
1 janv. 2011
1.305 mds
+191.039 mln.
17.16%
1 janv. 2012
3.259 mds
+1.954 mds
149.81%
1 janv. 2013
2.873 mds
-386.479 mln.
-11.86%
1 janv. 2014
1.434 mds
-1.439 mds
-50.09%
1 janv. 2015
485.807 mln.
-947.824 mln.
-66.11%
1 janv. 2016
284.648 mln.
-201.159 mln.
-41.41%
Classement des pays selon les statistiques actuelles par années


Commentaires: