29
/fr/
fr
AIzaSyAYiBZKx7MnpbEhh9jyipgxe19OcubqV5w
April 1, 2024
76200
Bahamas, The
BHS
true
2
1
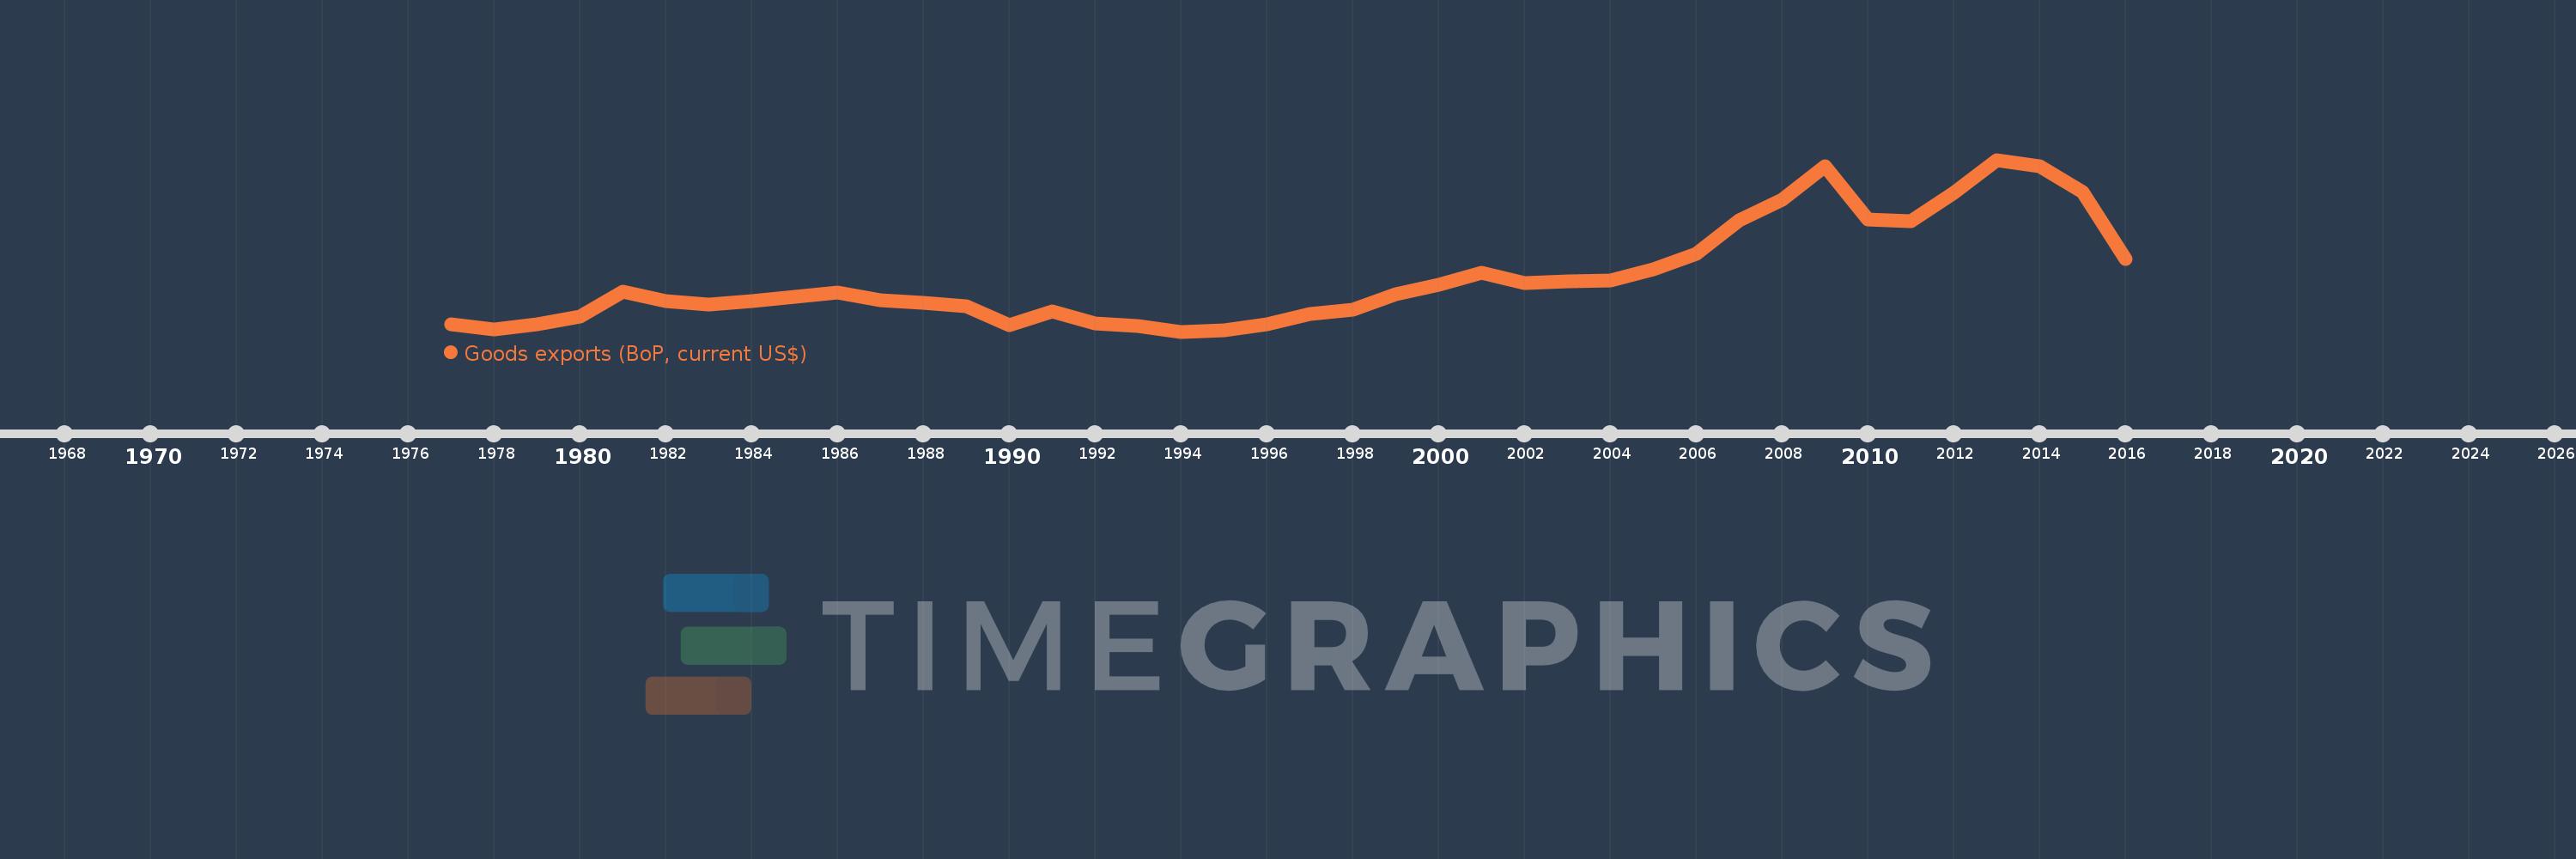
Goods exports (BoP, current US$)
2016,2015,2014,2013,2012,2011,2010,2009,2008,2007,2006,2005,2004,2003,2002,2001,2000,1999,1998,1997,1996,1995,1994,1993,1992,1991,1990,1989,1988,1987,1986,1985,1984,1983,1982,1981,1980,1979,1978,1977
Cette statistique dans les autres pays:
AfghanistanAlbaniaAlgeriaAngolaAntigua and BarbudaArab WorldArgentinaArmeniaArubaAustraliaAustriaAzerbaijanBahamas, TheBahrainBangladeshBarbadosBelarusBelgiumBelizeBeninBermudaBhutanBoliviaBosnia and HerzegovinaBotswanaBrazilBrunei DarussalamBulgariaBurkina FasoBurundiCabo VerdeCambodiaCameroonCanadaCaribbean small statesCentral African RepublicCentral Europe and the BalticsChadChileChinaColombiaComorosCongo, Dem. Rep.Congo, Rep.Costa RicaCote d'IvoireCroatiaCuracaoCyprusCzech RepublicDenmarkDjiboutiDominicaDominican RepublicEarly-demographic dividendEast Asia & PacificEast Asia & Pacific (excluding high income)East Asia & Pacific (IDA & IBRD countries)EcuadorEgypt, Arab Rep.El SalvadorEquatorial GuineaEritreaEstoniaEthiopiaEuro areaEurope & Central AsiaEurope & Central Asia (excluding high income)Europe & Central Asia (IDA & IBRD countries)European UnionFaroe IslandsFijiFinlandFragile and conflict affected situationsFranceFrench PolynesiaGabonGambia, TheGeorgiaGermanyGhanaGreeceGrenadaGuatemalaGuineaGuinea-BissauGuyanaHaitiHeavily indebted poor countries (HIPC)High incomeHondurasHong Kong SAR, ChinaHungaryIBRD onlyIcelandIDA & IBRD totalIDA blendIDA onlyIDA totalIndiaIndonesiaIran, Islamic Rep.IraqIrelandIsraelItalyJamaicaJapanJordanKazakhstanKenyaKiribatiKorea, Rep.KosovoKuwaitKyrgyz RepublicLao PDRLate-demographic dividendLatin America & Caribbean Latin America & Caribbean (excluding high income)Latin America & the Caribbean (IDA & IBRD countries)LatviaLeast developed countries: UN classificationLebanonLesothoLiberiaLibyaLithuaniaLow & middle incomeLow incomeLower middle incomeLuxembourgMacao SAR, ChinaMacedonia, FYRMadagascarMalawiMalaysiaMaldivesMaliMaltaMarshall IslandsMauritaniaMauritiusMexicoMicronesia, Fed. Sts.Middle East & North Africa (excluding high income)Middle East & North Africa (IDA & IBRD countries)Middle incomeMoldovaMongoliaMontenegroMoroccoMozambiqueMyanmarNamibiaNepalNetherlandsNew CaledoniaNew ZealandNicaraguaNigerNigeriaNorth AmericaNorwayOECD membersOmanPacific island small statesPakistanPalauPanamaPapua New GuineaParaguayPeruPhilippinesPolandPortugalPost-demographic dividendPre-demographic dividendQatarRomaniaRussian FederationRwandaSamoaSao Tome and PrincipeSaudi ArabiaSenegalSerbiaSeychellesSierra LeoneSingaporeSint Maarten (Dutch part)Slovak RepublicSloveniaSolomon IslandsSouth AfricaSouth AsiaSouth Asia (IDA & IBRD)South SudanSpainSri LankaSt. Kitts and NevisSt. LuciaSt. Vincent and the GrenadinesSub-Saharan Africa Sub-Saharan Africa (excluding high income)Sub-Saharan Africa (IDA & IBRD countries)SudanSurinameSwazilandSwedenSwitzerlandSyrian Arab RepublicTajikistanTanzaniaThailandTimor-LesteTogoTongaTrinidad and TobagoTunisiaTurkeyTuvaluUgandaUkraineUnited KingdomUnited StatesUpper middle incomeUruguayVanuatuVenezuela, RBVietnamWest Bank and GazaWorldYemen, Rep.ZambiaZimbabwe La ligne de temps
Cette échelle de temps montre un graphique de 1977 année à 2016 année Bahamas, The. Les données jusqu'à 1976 année ne sont pas présentés. Quantité d'observations actuelles selon dates: 40.
Source (désignation):
Les indicateurs du développement mondiale
Source (organisation):
International Monetary Fund, Balance of Payments Statistics Yearbook and data files.
Catégories:
Economy & Growth, Trade
Dernière mise à jour
23 avr. 2017
Les indicateurs de changement de valeurs selon les années
Minimum:
192.2 mln.
1 janv. 1994
Maximum:
984.017 mln.
1 janv. 2013
Pour la date d''observation
Valeur
Changement absolu
Le changement par rapport à la valeur précédente
1 janv. 1977
227.5 mln.
+227.5 mln.
0.0%
1 janv. 1978
201.9 mln.
-25.6 mln.
-11.25%
1 janv. 1979
224.4 mln.
+22.5 mln.
11.14%
1 janv. 1980
260.7 mln.
+36.3 mln.
16.18%
1 janv. 1981
377.1 mln.
+116.4 mln.
44.65%
1 janv. 1982
332.1 mln.
-45.0 mln.
-11.93%
1 janv. 1983
316.9 mln.
-15.2 mln.
-4.58%
1 janv. 1984
332.9 mln.
+16.0 mln.
5.05%
1 janv. 1985
353.8 mln.
+20.9 mln.
6.28%
1 janv. 1986
370.5 mln.
+16.7 mln.
4.72%
1 janv. 1987
335.3 mln.
-35.2 mln.
-9.5%
1 janv. 1988
324.8 mln.
-10.5 mln.
-3.13%
1 janv. 1989
310.8 mln.
-14.0 mln.
-4.31%
1 janv. 1990
221.0 mln.
-89.8 mln.
-28.89%
1 janv. 1991
283.5 mln.
+62.5 mln.
28.28%
1 janv. 1992
229.4 mln.
-54.1 mln.
-19.08%
1 janv. 1993
216.6 mln.
-12.8 mln.
-5.58%
1 janv. 1994
192.2 mln.
-24.4 mln.
-11.27%
1 janv. 1995
198.5 mln.
+6.3 mln.
3.28%
1 janv. 1996
225.4 mln.
+26.9 mln.
13.55%
1 janv. 1997
273.3 mln.
+47.9 mln.
21.25%
1 janv. 1998
295.0 mln.
+21.7 mln.
7.94%
1 janv. 1999
362.9 mln.
+67.9 mln.
23.02%
1 janv. 2000
406.8 mln.
+43.9 mln.
12.1%
1 janv. 2001
464.8 mln.
+58.0 mln.
14.26%
1 janv. 2002
416.9 mln.
-47.9 mln.
-10.31%
1 janv. 2003
422.067 mln.
+5.167 mln.
1.24%
1 janv. 2004
426.53 mln.
+4.463 mln.
1.06%
1 janv. 2005
477.46 mln.
+50.93 mln.
11.94%
1 janv. 2006
549.133 mln.
+71.673 mln.
15.01%
1 janv. 2007
703.54 mln.
+154.407 mln.
28.12%
1 janv. 2008
801.874 mln.
+98.334 mln.
13.98%
1 janv. 2009
955.822 mln.
+153.948 mln.
19.2%
1 janv. 2010
710.68 mln.
-245.142 mln.
-25.65%
1 janv. 2011
702.435 mln.
-8.245 mln.
-1.16%
1 janv. 2012
833.539 mln.
+131.104 mln.
18.66%
1 janv. 2013
984.017 mln.
+150.478 mln.
18.05%
1 janv. 2014
954.914 mln.
-29.103 mln.
-2.96%
1 janv. 2015
833.944 mln.
-120.97 mln.
-12.67%
1 janv. 2016
526.789 mln.
-307.156 mln.
-36.83%
Classement des pays selon les statistiques actuelles par années


Commentaires: