29
/fr/
fr
AIzaSyAYiBZKx7MnpbEhh9jyipgxe19OcubqV5w
April 1, 2024
160522
Israel
ISR
true
2
1
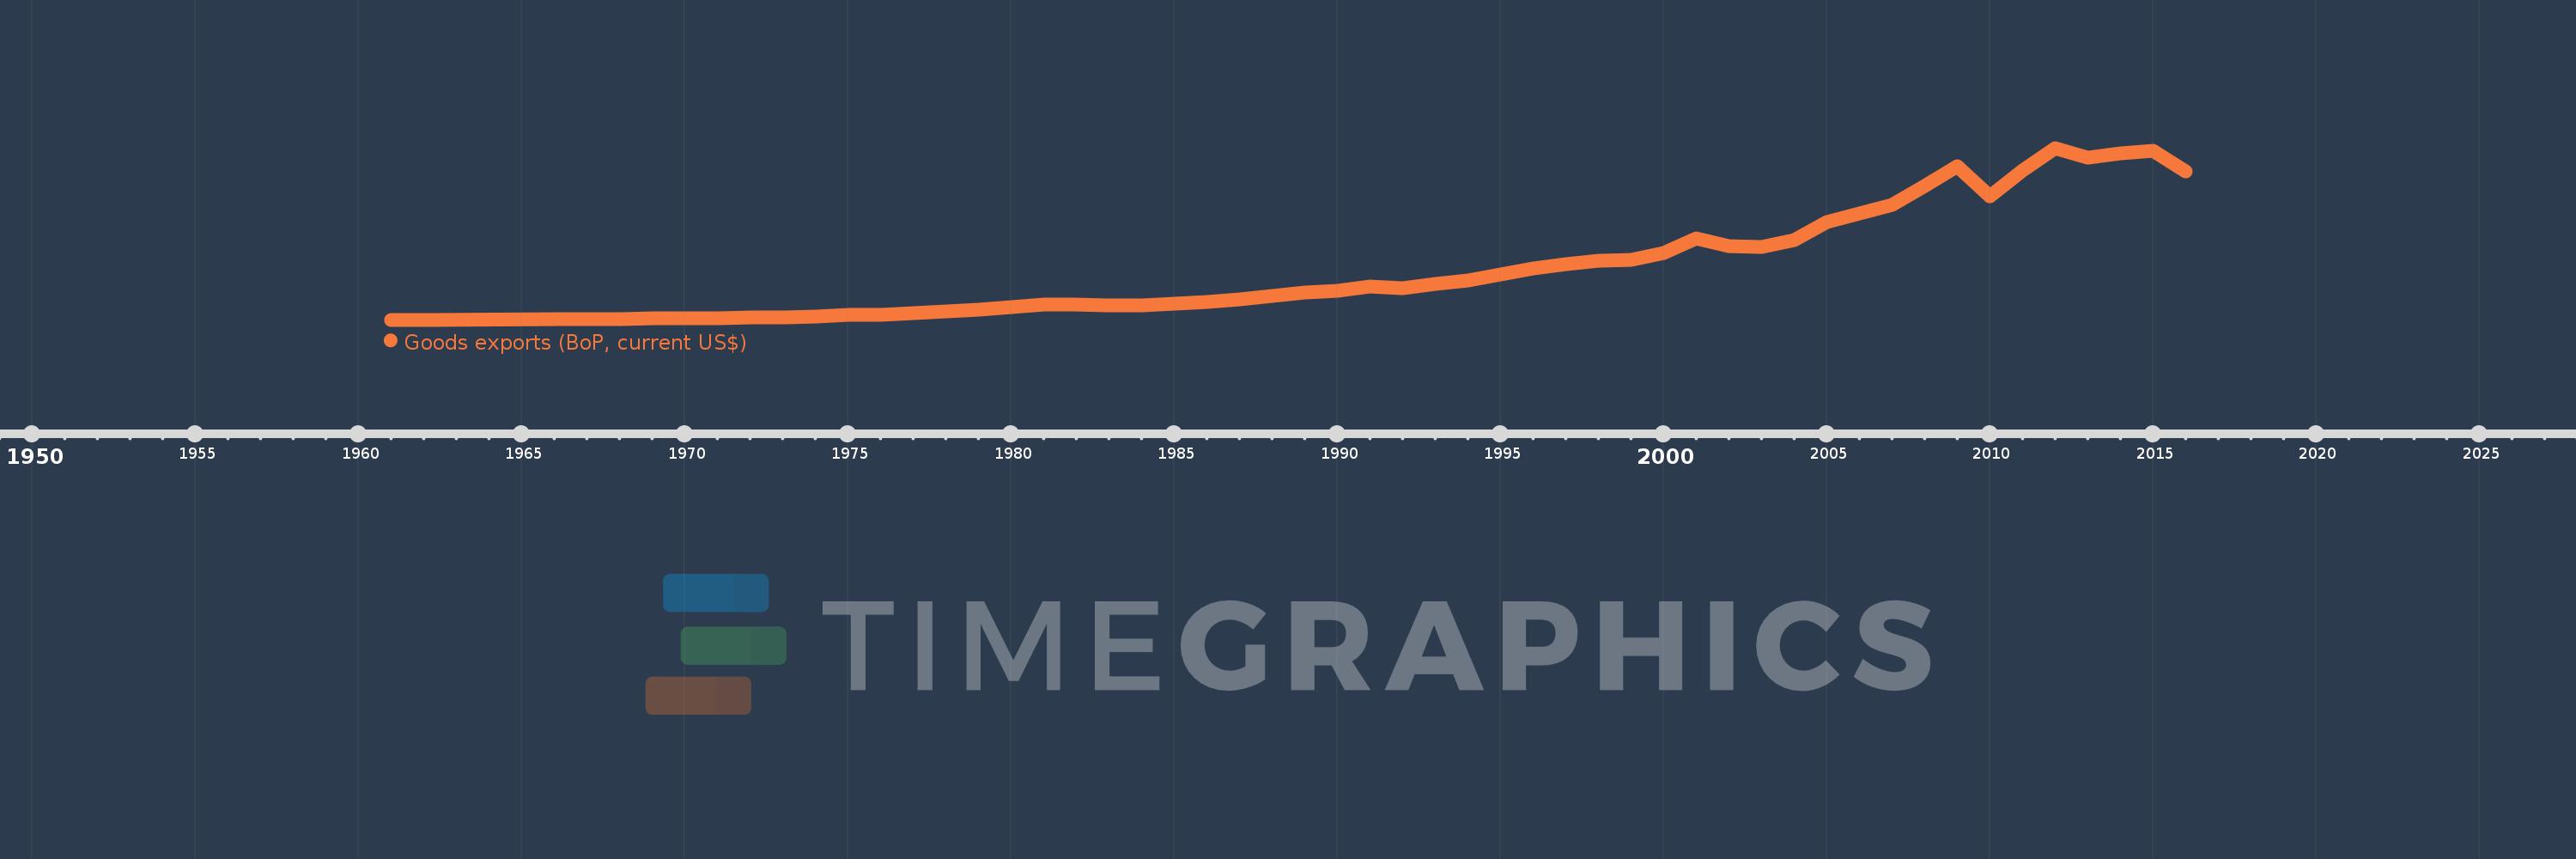
Goods exports (BoP, current US$)
2016,2015,2014,2013,2012,2011,2010,2009,2008,2007,2006,2005,2004,2003,2002,2001,2000,1999,1998,1997,1996,1995,1994,1993,1992,1991,1990,1989,1988,1987,1986,1985,1984,1983,1982,1981,1980,1979,1978,1977,1976,1975,1974,1973,1972,1971,1970,1969,1968,1967,1966,1962,1961
Cette statistique dans les autres pays:
AfghanistanAlbaniaAlgeriaAngolaAntigua and BarbudaArab WorldArgentinaArmeniaArubaAustraliaAustriaAzerbaijanBahamas, TheBahrainBangladeshBarbadosBelarusBelgiumBelizeBeninBermudaBhutanBoliviaBosnia and HerzegovinaBotswanaBrazilBrunei DarussalamBulgariaBurkina FasoBurundiCabo VerdeCambodiaCameroonCanadaCaribbean small statesCentral African RepublicCentral Europe and the BalticsChadChileChinaColombiaComorosCongo, Dem. Rep.Congo, Rep.Costa RicaCote d'IvoireCroatiaCuracaoCyprusCzech RepublicDenmarkDjiboutiDominicaDominican RepublicEarly-demographic dividendEast Asia & PacificEast Asia & Pacific (excluding high income)East Asia & Pacific (IDA & IBRD countries)EcuadorEgypt, Arab Rep.El SalvadorEquatorial GuineaEritreaEstoniaEthiopiaEuro areaEurope & Central AsiaEurope & Central Asia (excluding high income)Europe & Central Asia (IDA & IBRD countries)European UnionFaroe IslandsFijiFinlandFragile and conflict affected situationsFranceFrench PolynesiaGabonGambia, TheGeorgiaGermanyGhanaGreeceGrenadaGuatemalaGuineaGuinea-BissauGuyanaHaitiHeavily indebted poor countries (HIPC)High incomeHondurasHong Kong SAR, ChinaHungaryIBRD onlyIcelandIDA & IBRD totalIDA blendIDA onlyIDA totalIndiaIndonesiaIran, Islamic Rep.IraqIrelandIsraelItalyJamaicaJapanJordanKazakhstanKenyaKiribatiKorea, Rep.KosovoKuwaitKyrgyz RepublicLao PDRLate-demographic dividendLatin America & Caribbean Latin America & Caribbean (excluding high income)Latin America & the Caribbean (IDA & IBRD countries)LatviaLeast developed countries: UN classificationLebanonLesothoLiberiaLibyaLithuaniaLow & middle incomeLow incomeLower middle incomeLuxembourgMacao SAR, ChinaMacedonia, FYRMadagascarMalawiMalaysiaMaldivesMaliMaltaMarshall IslandsMauritaniaMauritiusMexicoMicronesia, Fed. Sts.Middle East & North Africa (excluding high income)Middle East & North Africa (IDA & IBRD countries)Middle incomeMoldovaMongoliaMontenegroMoroccoMozambiqueMyanmarNamibiaNepalNetherlandsNew CaledoniaNew ZealandNicaraguaNigerNigeriaNorth AmericaNorwayOECD membersOmanPacific island small statesPakistanPalauPanamaPapua New GuineaParaguayPeruPhilippinesPolandPortugalPost-demographic dividendPre-demographic dividendQatarRomaniaRussian FederationRwandaSamoaSao Tome and PrincipeSaudi ArabiaSenegalSerbiaSeychellesSierra LeoneSingaporeSint Maarten (Dutch part)Slovak RepublicSloveniaSolomon IslandsSouth AfricaSouth AsiaSouth Asia (IDA & IBRD)South SudanSpainSri LankaSt. Kitts and NevisSt. LuciaSt. Vincent and the GrenadinesSub-Saharan Africa Sub-Saharan Africa (excluding high income)Sub-Saharan Africa (IDA & IBRD countries)SudanSurinameSwazilandSwedenSwitzerlandSyrian Arab RepublicTajikistanTanzaniaThailandTimor-LesteTogoTongaTrinidad and TobagoTunisiaTurkeyTuvaluUgandaUkraineUnited KingdomUnited StatesUpper middle incomeUruguayVanuatuVenezuela, RBVietnamWest Bank and GazaWorldYemen, Rep.ZambiaZimbabwe La ligne de temps
Cette échelle de temps montre un graphique de 1961 année à 2016 année Israel. Les données jusqu'à 1960 année ne sont pas présentés. Quantité d'observations actuelles selon dates: 53.
Source (désignation):
Les indicateurs du développement mondiale
Source (organisation):
International Monetary Fund, Balance of Payments Statistics Yearbook and data files.
Catégories:
Economy & Growth, Trade
Dernière mise à jour
23 avr. 2017
Les indicateurs de changement de valeurs selon les années
Minimum:
213.0 mln.
1 janv. 1961
Maximum:
64.986 mds
1 janv. 2012
Pour la date d''observation
Valeur
Changement absolu
Le changement par rapport à la valeur précédente
1 janv. 1961
213.0 mln.
+213.0 mln.
0.0%
1 janv. 1962
240.0 mln.
+27.0 mln.
12.68%
1 janv. 1966
408.0 mln.
+168.0 mln.
70.0%
1 janv. 1967
480.0 mln.
+72.0 mln.
17.65%
1 janv. 1968
535.0 mln.
+55.0 mln.
11.46%
1 janv. 1969
657.0 mln.
+122.0 mln.
22.8%
1 janv. 1970
758.0 mln.
+101.0 mln.
15.37%
1 janv. 1971
814.0 mln.
+56.0 mln.
7.39%
1 janv. 1972
1.012 mds
+198.0 mln.
24.32%
1 janv. 1973
1.227 mds
+215.0 mln.
21.25%
1 janv. 1974
1.571 mds
+344.0 mln.
28.04%
1 janv. 1975
2.029 mds
+458.0 mln.
29.15%
1 janv. 1976
2.192 mds
+163.0 mln.
8.03%
1 janv. 1977
2.688 mds
+496.0 mln.
22.63%
1 janv. 1978
3.422 mds
+734.0 mln.
27.31%
1 janv. 1979
4.104 mds
+682.0 mln.
19.93%
1 janv. 1980
4.841 mds
+737.0 mln.
17.96%
1 janv. 1981
5.946 mds
+1.105 mds
22.83%
1 janv. 1982
6.095 mds
+148.6 mln.
2.5%
1 janv. 1983
5.75 mds
-344.9 mln.
-5.66%
1 janv. 1984
5.722 mds
-28.1 mln.
-0.49%
1 janv. 1985
6.38 mds
+658.5 mln.
11.51%
1 janv. 1986
6.826 mds
+445.5 mln.
6.98%
1 janv. 1987
7.894 mds
+1.068 mds
15.65%
1 janv. 1988
9.311 mds
+1.417 mds
17.95%
1 janv. 1989
10.35 mds
+1.039 mds
11.16%
1 janv. 1990
11.142 mds
+792.1 mln.
7.65%
1 janv. 1991
12.743 mds
+1.601 mds
14.37%
1 janv. 1992
12.233 mds
-510.7 mln.
-4.01%
1 janv. 1993
13.621 mds
+1.388 mds
11.35%
1 janv. 1994
14.926 mds
+1.305 mds
9.58%
1 janv. 1995
17.242 mds
+2.316 mds
15.52%
1 janv. 1996
19.526 mds
+2.284 mds
13.25%
1 janv. 1997
21.289 mds
+1.763 mds
9.03%
1 janv. 1998
22.573 mds
+1.284 mds
6.03%
1 janv. 1999
22.778 mds
+205.0 mln.
0.91%
1 janv. 2000
25.457 mds
+2.679 mds
11.76%
1 janv. 2001
30.89 mds
+5.433 mds
21.34%
1 janv. 2002
27.968 mds
-2.923 mds
-9.46%
1 janv. 2003
27.645 mds
-322.1 mln.
-1.15%
1 janv. 2004
30.395 mds
+2.75 mds
9.95%
1 janv. 2005
36.915 mds
+6.52 mds
21.45%
1 janv. 2006
40.376 mds
+3.46 mds
9.37%
1 janv. 2007
43.492 mds
+3.117 mds
7.72%
1 janv. 2008
50.758 mds
+7.266 mds
16.71%
1 janv. 2009
58.011 mds
+7.253 mds
14.29%
1 janv. 2010
46.805 mds
-11.206 mds
-19.32%
1 janv. 2011
56.414 mds
+9.609 mds
20.53%
1 janv. 2012
64.986 mds
+8.572 mds
15.2%
1 janv. 2013
61.282 mds
-3.703 mds
-5.7%
1 janv. 2014
62.998 mds
+1.715 mds
2.8%
1 janv. 2015
63.761 mds
+763.3 mln.
1.21%
1 janv. 2016
56.29 mds
-7.471 mds
-11.72%
Classement des pays selon les statistiques actuelles par années


Commentaires: