29
/fr/
fr
AIzaSyAYiBZKx7MnpbEhh9jyipgxe19OcubqV5w
April 1, 2024
178889
Liberia
LBR
true
2
1
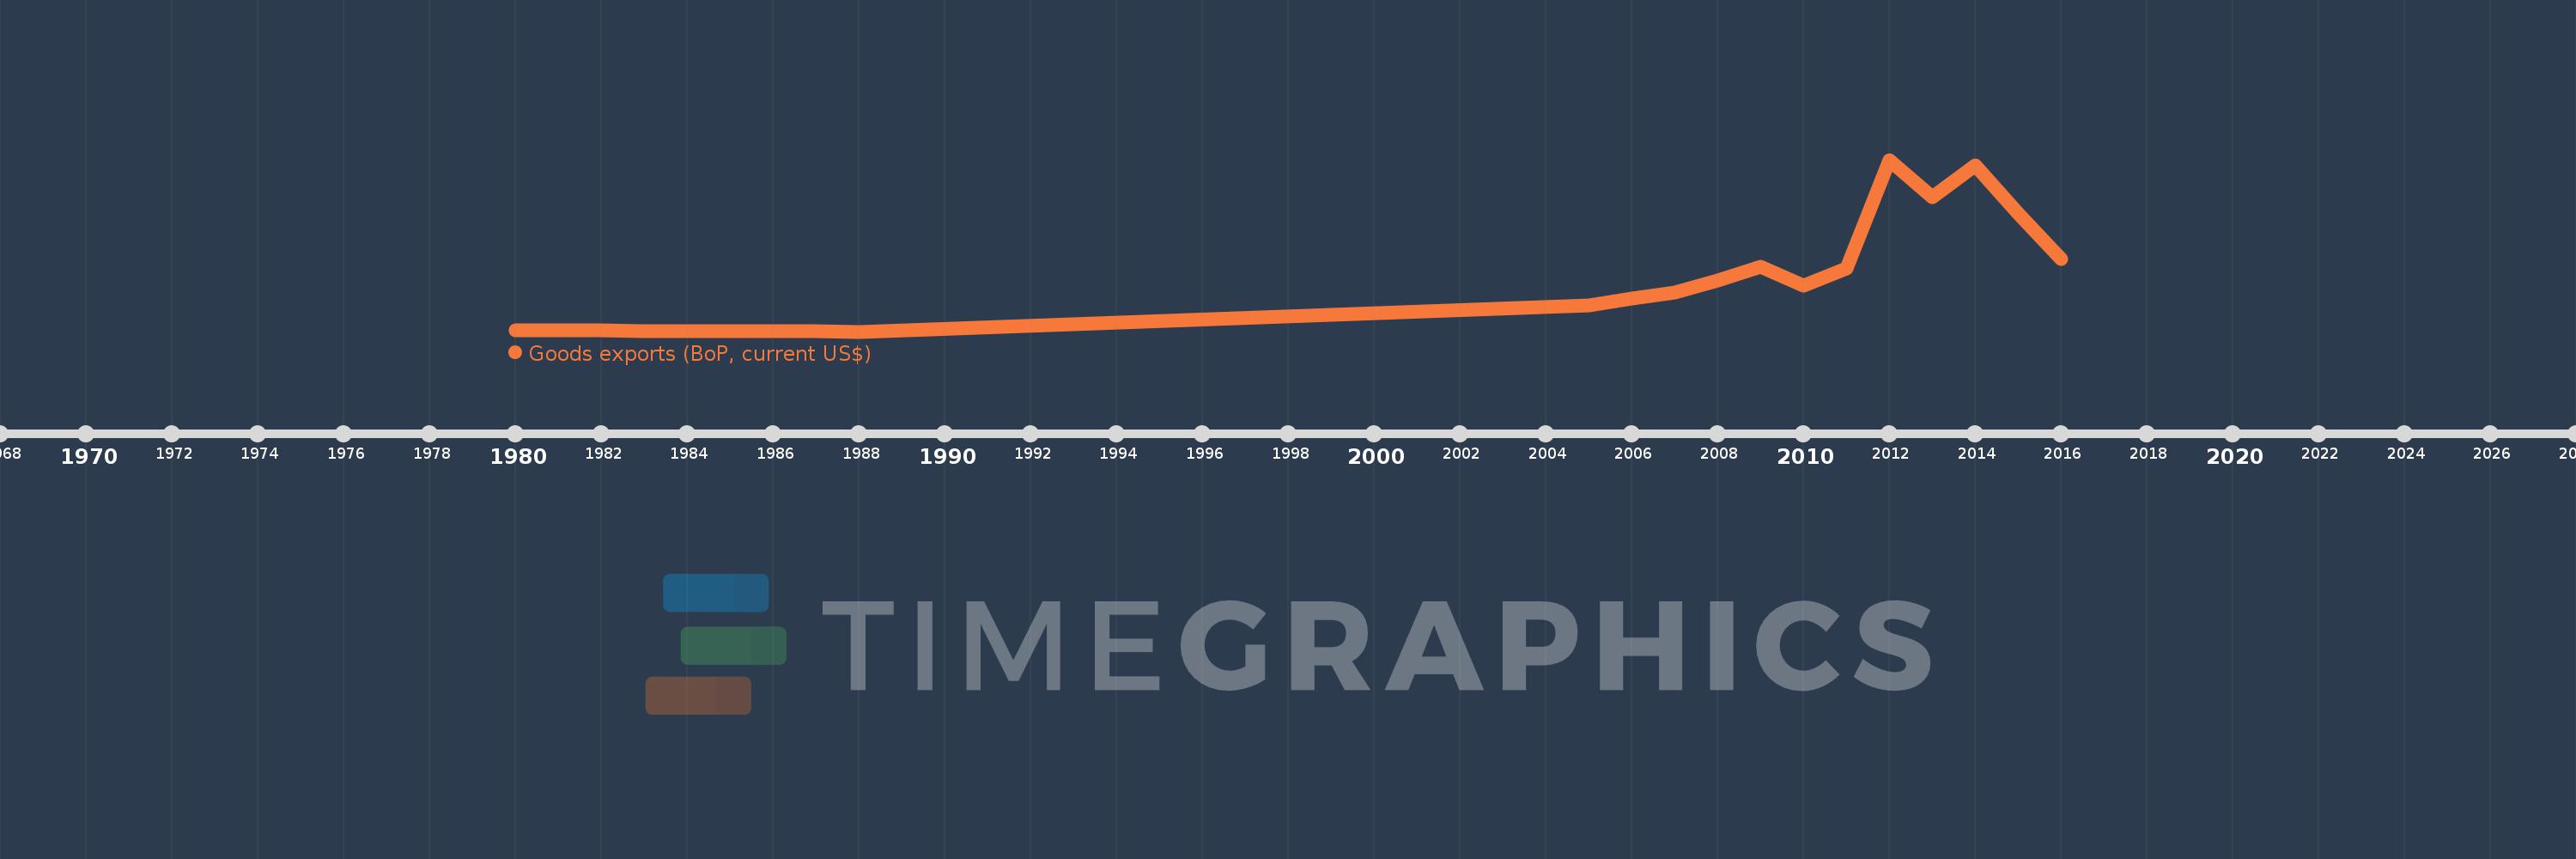
Goods exports (BoP, current US$)
2016,2015,2014,2013,2012,2011,2010,2009,2008,2007,2006,2005,1988,1987,1986,1985,1984,1983,1982,1981,1980
Cette statistique dans les autres pays:
AfghanistanAlbaniaAlgeriaAngolaAntigua and BarbudaArab WorldArgentinaArmeniaArubaAustraliaAustriaAzerbaijanBahamas, TheBahrainBangladeshBarbadosBelarusBelgiumBelizeBeninBermudaBhutanBoliviaBosnia and HerzegovinaBotswanaBrazilBrunei DarussalamBulgariaBurkina FasoBurundiCabo VerdeCambodiaCameroonCanadaCaribbean small statesCentral African RepublicCentral Europe and the BalticsChadChileChinaColombiaComorosCongo, Dem. Rep.Congo, Rep.Costa RicaCote d'IvoireCroatiaCuracaoCyprusCzech RepublicDenmarkDjiboutiDominicaDominican RepublicEarly-demographic dividendEast Asia & PacificEast Asia & Pacific (excluding high income)East Asia & Pacific (IDA & IBRD countries)EcuadorEgypt, Arab Rep.El SalvadorEquatorial GuineaEritreaEstoniaEthiopiaEuro areaEurope & Central AsiaEurope & Central Asia (excluding high income)Europe & Central Asia (IDA & IBRD countries)European UnionFaroe IslandsFijiFinlandFragile and conflict affected situationsFranceFrench PolynesiaGabonGambia, TheGeorgiaGermanyGhanaGreeceGrenadaGuatemalaGuineaGuinea-BissauGuyanaHaitiHeavily indebted poor countries (HIPC)High incomeHondurasHong Kong SAR, ChinaHungaryIBRD onlyIcelandIDA & IBRD totalIDA blendIDA onlyIDA totalIndiaIndonesiaIran, Islamic Rep.IraqIrelandIsraelItalyJamaicaJapanJordanKazakhstanKenyaKiribatiKorea, Rep.KosovoKuwaitKyrgyz RepublicLao PDRLate-demographic dividendLatin America & Caribbean Latin America & Caribbean (excluding high income)Latin America & the Caribbean (IDA & IBRD countries)LatviaLeast developed countries: UN classificationLebanonLesothoLiberiaLibyaLithuaniaLow & middle incomeLow incomeLower middle incomeLuxembourgMacao SAR, ChinaMacedonia, FYRMadagascarMalawiMalaysiaMaldivesMaliMaltaMarshall IslandsMauritaniaMauritiusMexicoMicronesia, Fed. Sts.Middle East & North Africa (excluding high income)Middle East & North Africa (IDA & IBRD countries)Middle incomeMoldovaMongoliaMontenegroMoroccoMozambiqueMyanmarNamibiaNepalNetherlandsNew CaledoniaNew ZealandNicaraguaNigerNigeriaNorth AmericaNorwayOECD membersOmanPacific island small statesPakistanPalauPanamaPapua New GuineaParaguayPeruPhilippinesPolandPortugalPost-demographic dividendPre-demographic dividendQatarRomaniaRussian FederationRwandaSamoaSao Tome and PrincipeSaudi ArabiaSenegalSerbiaSeychellesSierra LeoneSingaporeSint Maarten (Dutch part)Slovak RepublicSloveniaSolomon IslandsSouth AfricaSouth AsiaSouth Asia (IDA & IBRD)South SudanSpainSri LankaSt. Kitts and NevisSt. LuciaSt. Vincent and the GrenadinesSub-Saharan Africa Sub-Saharan Africa (excluding high income)Sub-Saharan Africa (IDA & IBRD countries)SudanSurinameSwazilandSwedenSwitzerlandSyrian Arab RepublicTajikistanTanzaniaThailandTimor-LesteTogoTongaTrinidad and TobagoTunisiaTurkeyTuvaluUgandaUkraineUnited KingdomUnited StatesUpper middle incomeUruguayVanuatuVenezuela, RBVietnamWest Bank and GazaWorldYemen, Rep.ZambiaZimbabwe La ligne de temps
Cette échelle de temps montre un graphique de 1980 année à 2016 année Liberia. Les données jusqu'à 1979 année ne sont pas présentés. Quantité d'observations actuelles selon dates: 21.
Source (désignation):
Les indicateurs du développement mondiale
Source (organisation):
International Monetary Fund, Balance of Payments Statistics Yearbook and data files.
Catégories:
Economy & Growth, Trade
Dernière mise à jour
23 avr. 2017
Les indicateurs de changement de valeurs selon les années
Minimum:
8.073 mln.
1 janv. 1988
Maximum:
645.659 mln.
1 janv. 2012
Pour la date d''observation
Valeur
Changement absolu
Le changement par rapport à la valeur précédente
1 janv. 1980
11.555 mln.
+11.555 mln.
0.0%
1 janv. 1981
12.929 mln.
+1.374 mln.
11.89%
1 janv. 1982
11.396 mln.
-1.533 mln.
-11.86%
1 janv. 1983
10.28 mln.
-1.115 mln.
-9.79%
1 janv. 1984
9.061 mln.
-1.219 mln.
-11.86%
1 janv. 1985
9.619 mln.
+557.724 milles
6.15%
1 janv. 1986
9.268 mln.
-351.0 milles
-3.65%
1 janv. 1987
8.784 mln.
-484.509 milles
-5.23%
1 janv. 1988
8.073 mln.
-710.614 milles
-8.09%
1 janv. 2005
104.792 mln.
+96.719 mln.
1.2 milles%
1 janv. 2006
132.263 mln.
+27.471 mln.
26.21%
1 janv. 2007
154.636 mln.
+22.373 mln.
16.92%
1 janv. 2008
196.199 mln.
+41.564 mln.
26.88%
1 janv. 2009
248.964 mln.
+52.765 mln.
26.89%
1 janv. 2010
179.972 mln.
-68.992 mln.
-27.71%
1 janv. 2011
241.21 mln.
+61.238 mln.
34.03%
1 janv. 2012
645.659 mln.
+404.448 mln.
167.67%
1 janv. 2013
507.213 mln.
-138.446 mln.
-21.44%
1 janv. 2014
624.326 mln.
+117.113 mln.
23.09%
1 janv. 2015
446.035 mln.
-178.291 mln.
-28.56%
1 janv. 2016
277.033 mln.
-169.002 mln.
-37.89%
Classement des pays selon les statistiques actuelles par années


Commentaires: