30
/fr/
AIzaSyAYiBZKx7MnpbEhh9jyipgxe19OcubqV5w
April 1, 2024
135557
Gabon
GAB
true
2
1
Goods exports (BoP, current US$)
2006,2005,2004,2003,2002,2001,2000,1999,1998,1997,1996,1995,1994,1993,1992,1991,1990,1989,1988,1987,1986,1985,1984,1983,1982,1981,1980,1979
Download
Bibliothèque de statistiques globales →Gabon →

Goods exports (BoP, current US$)

Cette statistique dans les autres pays:

AfghanistanAlbaniaAlgeriaAngolaAntigua and BarbudaArab WorldArgentinaArmeniaArubaAustraliaAustriaAzerbaijanBahamas, TheBahrainBangladeshBarbadosBelarusBelgiumBelizeBeninBermudaBhutanBoliviaBosnia and HerzegovinaBotswanaBrazilBrunei DarussalamBulgariaBurkina FasoBurundiCabo VerdeCambodiaCameroonCanadaCaribbean small statesCentral African RepublicCentral Europe and the BalticsChadChileChinaColombiaComorosCongo, Dem. Rep.Congo, Rep.Costa RicaCote d'IvoireCroatiaCuracaoCyprusCzech RepublicDenmarkDjiboutiDominicaDominican RepublicEarly-demographic dividendEast Asia & PacificEast Asia & Pacific (excluding high income)East Asia & Pacific (IDA & IBRD countries)EcuadorEgypt, Arab Rep.El SalvadorEquatorial GuineaEritreaEstoniaEthiopiaEuro areaEurope & Central AsiaEurope & Central Asia (excluding high income)Europe & Central Asia (IDA & IBRD countries)European UnionFaroe IslandsFijiFinlandFragile and conflict affected situationsFranceFrench PolynesiaGabonGambia, TheGeorgiaGermanyGhanaGreeceGrenadaGuatemalaGuineaGuinea-BissauGuyanaHaitiHeavily indebted poor countries (HIPC)High incomeHondurasHong Kong SAR, ChinaHungaryIBRD onlyIcelandIDA & IBRD totalIDA blendIDA onlyIDA totalIndiaIndonesiaIran, Islamic Rep.IraqIrelandIsraelItalyJamaicaJapanJordanKazakhstanKenyaKiribatiKorea, Rep.KosovoKuwaitKyrgyz RepublicLao PDRLate-demographic dividendLatin America & Caribbean Latin America & Caribbean (excluding high income)Latin America & the Caribbean (IDA & IBRD countries)LatviaLeast developed countries: UN classificationLebanonLesothoLiberiaLibyaLithuaniaLow & middle incomeLow incomeLower middle incomeLuxembourgMacao SAR, ChinaMacedonia, FYRMadagascarMalawiMalaysiaMaldivesMaliMaltaMarshall IslandsMauritaniaMauritiusMexicoMicronesia, Fed. Sts.Middle East & North Africa (excluding high income)Middle East & North Africa (IDA & IBRD countries)Middle incomeMoldovaMongoliaMontenegroMoroccoMozambiqueMyanmarNamibiaNepalNetherlandsNew CaledoniaNew ZealandNicaraguaNigerNigeriaNorth AmericaNorwayOECD membersOmanPacific island small statesPakistanPalauPanamaPapua New GuineaParaguayPeruPhilippinesPolandPortugalPost-demographic dividendPre-demographic dividendQatarRomaniaRussian FederationRwandaSamoaSao Tome and PrincipeSaudi ArabiaSenegalSerbiaSeychellesSierra LeoneSingaporeSint Maarten (Dutch part)Slovak RepublicSloveniaSolomon IslandsSouth AfricaSouth AsiaSouth Asia (IDA & IBRD)South SudanSpainSri LankaSt. Kitts and NevisSt. LuciaSt. Vincent and the GrenadinesSub-Saharan Africa Sub-Saharan Africa (excluding high income)Sub-Saharan Africa (IDA & IBRD countries)SudanSurinameSwazilandSwedenSwitzerlandSyrian Arab RepublicTajikistanTanzaniaThailandTimor-LesteTogoTongaTrinidad and TobagoTunisiaTurkeyTuvaluUgandaUkraineUnited KingdomUnited StatesUpper middle incomeUruguayVanuatuVenezuela, RBVietnamWest Bank and GazaWorldYemen, Rep.ZambiaZimbabwe

La ligne de temps

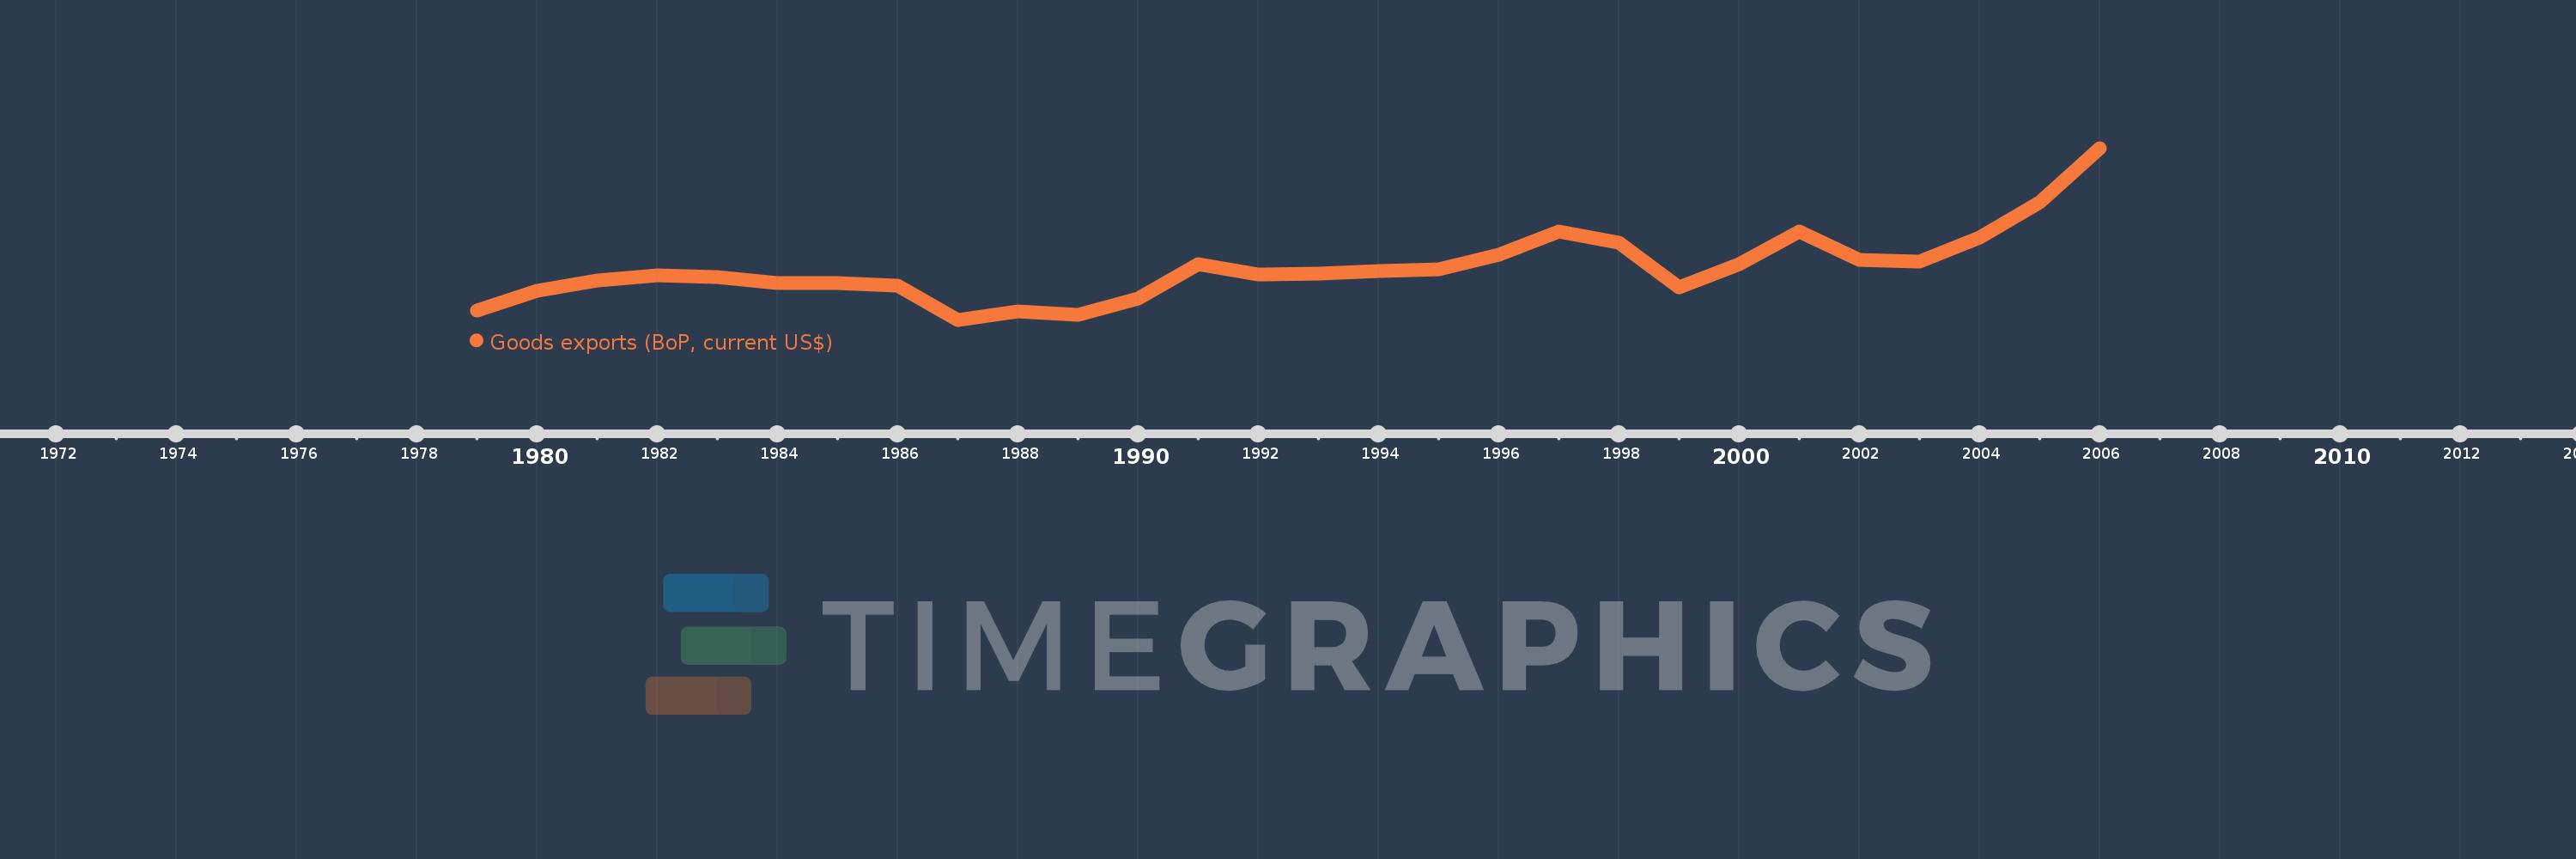
Cette échelle de temps montre un graphique de 1979 année à 2006 année Gabon. Les données jusqu'à 1978 année ne sont pas présentés. Quantité d'observations actuelles selon dates: 28.

Source (désignation):

Les indicateurs du développement mondiale

Source (organisation):

International Monetary Fund, Balance of Payments Statistics Yearbook and data files.

Catégories:

Economy & Growth, Trade

Dernière mise à jour

23 avr. 2017

Les indicateurs de changement de valeurs selon les années

En moyenne:
2.395 mds
Minimum:
1.074 mds
1 janv. 1987
Maximum:
5.457 mds
1 janv. 2006
Pour la date d''observation
Valeur
Changement absolu
Le changement par rapport à la valeur précédente
1 janv. 1979
1.309 mds
+1.309 mds
0.0%
1 janv. 1980
1.815 mds
+506.371 mln.
38.69%
1 janv. 1981
2.084 mds
+269.394 mln.
14.84%
1 janv. 1982
2.2 mds
+115.829 mln.
5.56%
1 janv. 1983
2.16 mds
-39.827 mln.
-1.81%
1 janv. 1984
2.0 mds
-160.271 mln.
-7.42%
1 janv. 1985
2.018 mds
+17.694 mln.
0.88%
1 janv. 1986
1.951 mds
-66.402 mln.
-3.29%
1 janv. 1987
1.074 mds
-877.224 mln.
-44.95%
1 janv. 1988
1.286 mds
+212.171 mln.
19.75%
1 janv. 1989
1.196 mds
-90.791 mln.
-7.06%
1 janv. 1990
1.626 mds
+430.432 mln.
36.0%
1 janv. 1991
2.489 mds
+862.746 mln.
53.06%
1 janv. 1992
2.228 mds
-260.875 mln.
-10.48%
1 janv. 1993
2.259 mds
+31.353 mln.
1.41%
1 janv. 1994
2.326 mds
+66.994 mln.
2.97%
1 janv. 1995
2.365 mds
+39.028 mln.
1.68%
1 janv. 1996
2.727 mds
+361.536 mln.
15.29%
1 janv. 1997
3.333 mds
+606.078 mln.
22.23%
1 janv. 1998
3.033 mds
-300.354 mln.
-9.01%
1 janv. 1999
1.908 mds
-1.125 mds
-37.09%
1 janv. 2000
2.495 mds
+587.079 mln.
30.78%
1 janv. 2001
3.316 mds
+821.303 mln.
32.92%
1 janv. 2002
2.61 mds
-705.722 mln.
-21.28%
1 janv. 2003
2.553 mds
-56.896 mln.
-2.18%
1 janv. 2004
3.177 mds
+623.354 mln.
24.41%
1 janv. 2005
4.069 mds
+892.41 mln.
28.09%
1 janv. 2006
5.457 mds
+1.388 mds
34.1%

Classement des pays selon les statistiques actuelles par années