29
/fr/
fr
AIzaSyAYiBZKx7MnpbEhh9jyipgxe19OcubqV5w
April 1, 2024
211741
Niger
NER
true
2
1
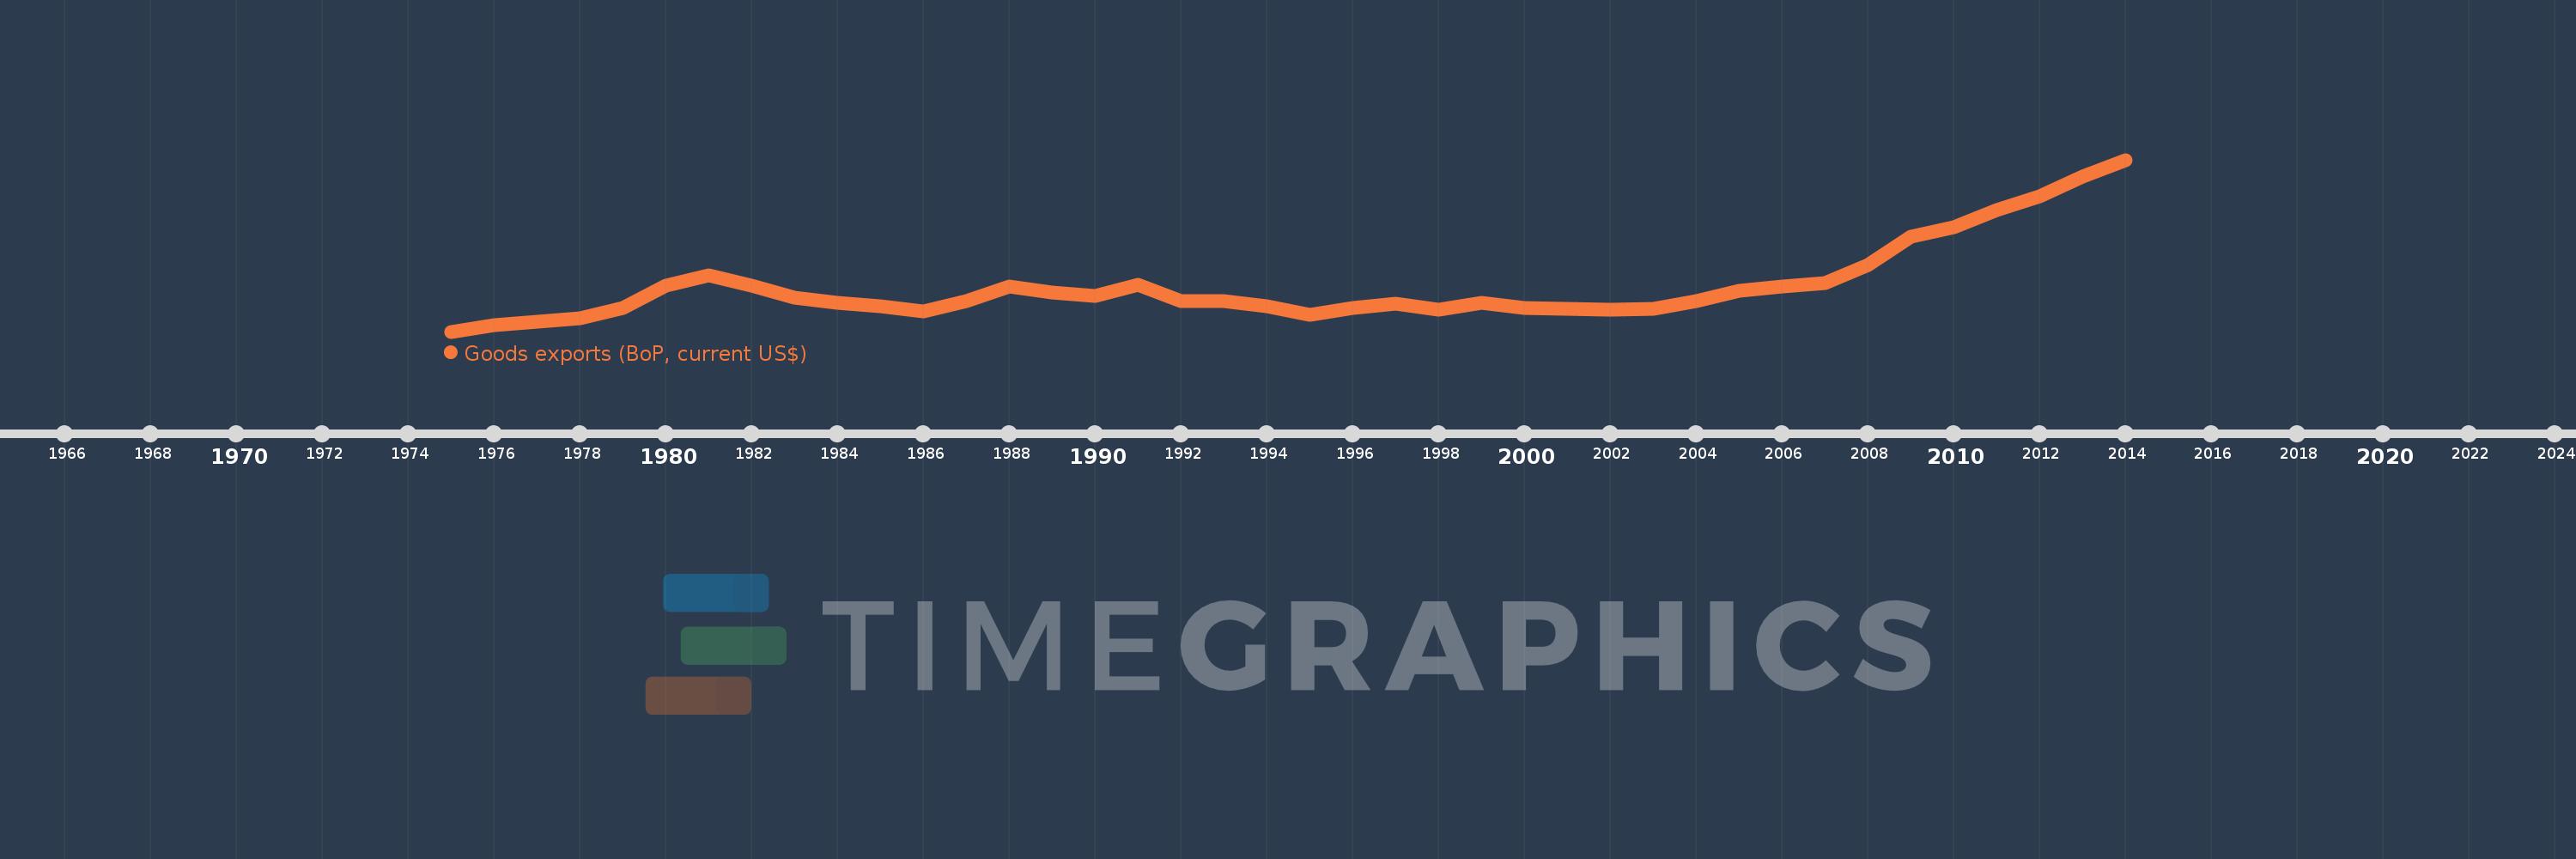
Goods exports (BoP, current US$)
2014,2013,2012,2011,2010,2009,2008,2007,2006,2005,2004,2003,2002,2001,2000,1999,1998,1997,1996,1995,1994,1993,1992,1991,1990,1989,1988,1987,1986,1985,1984,1983,1982,1981,1980,1979,1978,1977,1976,1975
Cette statistique dans les autres pays:
AfghanistanAlbaniaAlgeriaAngolaAntigua and BarbudaArab WorldArgentinaArmeniaArubaAustraliaAustriaAzerbaijanBahamas, TheBahrainBangladeshBarbadosBelarusBelgiumBelizeBeninBermudaBhutanBoliviaBosnia and HerzegovinaBotswanaBrazilBrunei DarussalamBulgariaBurkina FasoBurundiCabo VerdeCambodiaCameroonCanadaCaribbean small statesCentral African RepublicCentral Europe and the BalticsChadChileChinaColombiaComorosCongo, Dem. Rep.Congo, Rep.Costa RicaCote d'IvoireCroatiaCuracaoCyprusCzech RepublicDenmarkDjiboutiDominicaDominican RepublicEarly-demographic dividendEast Asia & PacificEast Asia & Pacific (excluding high income)East Asia & Pacific (IDA & IBRD countries)EcuadorEgypt, Arab Rep.El SalvadorEquatorial GuineaEritreaEstoniaEthiopiaEuro areaEurope & Central AsiaEurope & Central Asia (excluding high income)Europe & Central Asia (IDA & IBRD countries)European UnionFaroe IslandsFijiFinlandFragile and conflict affected situationsFranceFrench PolynesiaGabonGambia, TheGeorgiaGermanyGhanaGreeceGrenadaGuatemalaGuineaGuinea-BissauGuyanaHaitiHeavily indebted poor countries (HIPC)High incomeHondurasHong Kong SAR, ChinaHungaryIBRD onlyIcelandIDA & IBRD totalIDA blendIDA onlyIDA totalIndiaIndonesiaIran, Islamic Rep.IraqIrelandIsraelItalyJamaicaJapanJordanKazakhstanKenyaKiribatiKorea, Rep.KosovoKuwaitKyrgyz RepublicLao PDRLate-demographic dividendLatin America & Caribbean Latin America & Caribbean (excluding high income)Latin America & the Caribbean (IDA & IBRD countries)LatviaLeast developed countries: UN classificationLebanonLesothoLiberiaLibyaLithuaniaLow & middle incomeLow incomeLower middle incomeLuxembourgMacao SAR, ChinaMacedonia, FYRMadagascarMalawiMalaysiaMaldivesMaliMaltaMarshall IslandsMauritaniaMauritiusMexicoMicronesia, Fed. Sts.Middle East & North Africa (excluding high income)Middle East & North Africa (IDA & IBRD countries)Middle incomeMoldovaMongoliaMontenegroMoroccoMozambiqueMyanmarNamibiaNepalNetherlandsNew CaledoniaNew ZealandNicaraguaNigerNigeriaNorth AmericaNorwayOECD membersOmanPacific island small statesPakistanPalauPanamaPapua New GuineaParaguayPeruPhilippinesPolandPortugalPost-demographic dividendPre-demographic dividendQatarRomaniaRussian FederationRwandaSamoaSao Tome and PrincipeSaudi ArabiaSenegalSerbiaSeychellesSierra LeoneSingaporeSint Maarten (Dutch part)Slovak RepublicSloveniaSolomon IslandsSouth AfricaSouth AsiaSouth Asia (IDA & IBRD)South SudanSpainSri LankaSt. Kitts and NevisSt. LuciaSt. Vincent and the GrenadinesSub-Saharan Africa Sub-Saharan Africa (excluding high income)Sub-Saharan Africa (IDA & IBRD countries)SudanSurinameSwazilandSwedenSwitzerlandSyrian Arab RepublicTajikistanTanzaniaThailandTimor-LesteTogoTongaTrinidad and TobagoTunisiaTurkeyTuvaluUgandaUkraineUnited KingdomUnited StatesUpper middle incomeUruguayVanuatuVenezuela, RBVietnamWest Bank and GazaWorldYemen, Rep.ZambiaZimbabwe La ligne de temps
Cette échelle de temps montre un graphique de 1975 année à 2014 année Niger. Les données jusqu'à 1974 année ne sont pas présentés. Quantité d'observations actuelles selon dates: 40.
Source (désignation):
Les indicateurs du développement mondiale
Source (organisation):
International Monetary Fund, Balance of Payments Statistics Yearbook and data files.
Catégories:
Economy & Growth, Trade
Dernière mise à jour
23 avr. 2017
Les indicateurs de changement de valeurs selon les années
Minimum:
81.515 mln.
1 janv. 1975
Maximum:
1.588 mds
1 janv. 2014
Pour la date d''observation
Valeur
Changement absolu
Le changement par rapport à la valeur précédente
1 janv. 1975
81.515 mln.
+81.515 mln.
0.0%
1 janv. 1976
138.517 mln.
+57.002 mln.
69.93%
1 janv. 1977
171.638 mln.
+33.121 mln.
23.91%
1 janv. 1978
196.642 mln.
+25.004 mln.
14.57%
1 janv. 1979
287.65 mln.
+91.008 mln.
46.28%
1 janv. 1980
484.948 mln.
+197.298 mln.
68.59%
1 janv. 1981
576.085 mln.
+91.137 mln.
18.79%
1 janv. 1982
484.629 mln.
-91.456 mln.
-15.88%
1 janv. 1983
381.329 mln.
-103.3 mln.
-21.32%
1 janv. 1984
335.228 mln.
-46.101 mln.
-12.09%
1 janv. 1985
303.273 mln.
-31.955 mln.
-9.53%
1 janv. 1986
259.425 mln.
-43.848 mln.
-14.46%
1 janv. 1987
351.989 mln.
+92.564 mln.
35.68%
1 janv. 1988
477.399 mln.
+125.41 mln.
35.63%
1 janv. 1989
426.311 mln.
-51.088 mln.
-10.7%
1 janv. 1990
390.789 mln.
-35.522 mln.
-8.33%
1 janv. 1991
488.389 mln.
+97.599 mln.
24.97%
1 janv. 1992
351.526 mln.
-136.862 mln.
-28.02%
1 janv. 1993
347.287 mln.
-4.239 mln.
-1.21%
1 janv. 1994
300.418 mln.
-46.869 mln.
-13.5%
1 janv. 1995
226.815 mln.
-73.602 mln.
-24.5%
1 janv. 1996
288.065 mln.
+61.249 mln.
27.0%
1 janv. 1997
324.743 mln.
+36.678 mln.
12.73%
1 janv. 1998
271.335 mln.
-53.408 mln.
-16.45%
1 janv. 1999
333.99 mln.
+62.655 mln.
23.09%
1 janv. 2000
286.791 mln.
-47.199 mln.
-14.13%
1 janv. 2001
283.092 mln.
-3.699 mln.
-1.29%
1 janv. 2002
272.492 mln.
-10.6 mln.
-3.74%
1 janv. 2003
279.444 mln.
+6.952 mln.
2.55%
1 janv. 2004
351.81 mln.
+72.366 mln.
25.9%
1 janv. 2005
436.651 mln.
+84.841 mln.
24.12%
1 janv. 2006
477.551 mln.
+40.9 mln.
9.37%
1 janv. 2007
507.952 mln.
+30.401 mln.
6.37%
1 janv. 2008
662.525 mln.
+154.573 mln.
30.43%
1 janv. 2009
912.158 mln.
+249.633 mln.
37.68%
1 janv. 2010
996.854 mln.
+84.697 mln.
9.29%
1 janv. 2011
1.151 mds
+154.162 mln.
15.46%
1 janv. 2012
1.27 mds
+119.374 mln.
10.37%
1 janv. 2013
1.442 mds
+171.964 mln.
13.54%
1 janv. 2014
1.588 mds
+145.794 mln.
10.11%
Classement des pays selon les statistiques actuelles par années


Commentaires: