29
/fr/
fr
AIzaSyAYiBZKx7MnpbEhh9jyipgxe19OcubqV5w
April 1, 2024
174145
Lao PDR
LAO
true
2
1
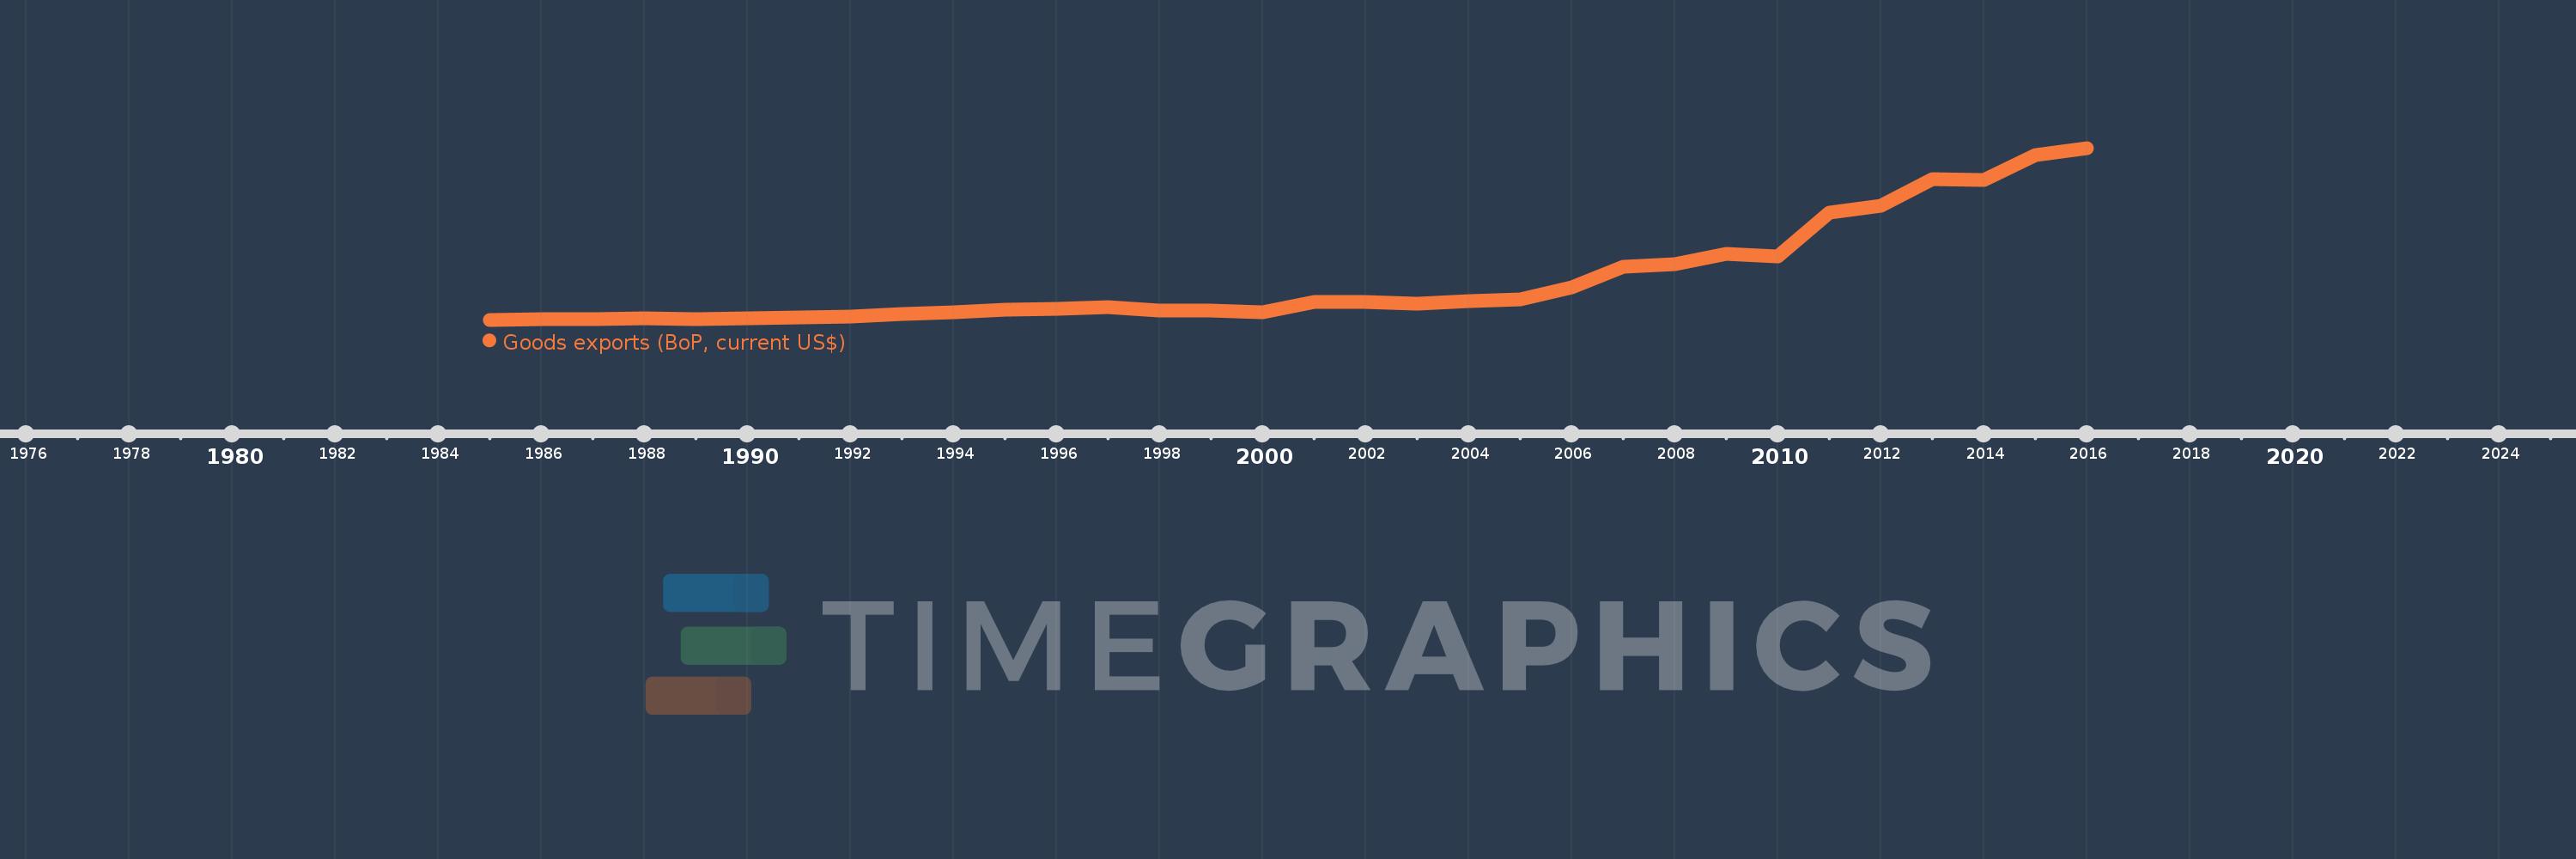
Goods exports (BoP, current US$)
2016,2015,2014,2013,2012,2011,2010,2009,2008,2007,2006,2005,2004,2003,2002,2001,2000,1999,1998,1997,1996,1995,1994,1993,1992,1991,1990,1989,1988,1987,1986,1985
Cette statistique dans les autres pays:
AfghanistanAlbaniaAlgeriaAngolaAntigua and BarbudaArab WorldArgentinaArmeniaArubaAustraliaAustriaAzerbaijanBahamas, TheBahrainBangladeshBarbadosBelarusBelgiumBelizeBeninBermudaBhutanBoliviaBosnia and HerzegovinaBotswanaBrazilBrunei DarussalamBulgariaBurkina FasoBurundiCabo VerdeCambodiaCameroonCanadaCaribbean small statesCentral African RepublicCentral Europe and the BalticsChadChileChinaColombiaComorosCongo, Dem. Rep.Congo, Rep.Costa RicaCote d'IvoireCroatiaCuracaoCyprusCzech RepublicDenmarkDjiboutiDominicaDominican RepublicEarly-demographic dividendEast Asia & PacificEast Asia & Pacific (excluding high income)East Asia & Pacific (IDA & IBRD countries)EcuadorEgypt, Arab Rep.El SalvadorEquatorial GuineaEritreaEstoniaEthiopiaEuro areaEurope & Central AsiaEurope & Central Asia (excluding high income)Europe & Central Asia (IDA & IBRD countries)European UnionFaroe IslandsFijiFinlandFragile and conflict affected situationsFranceFrench PolynesiaGabonGambia, TheGeorgiaGermanyGhanaGreeceGrenadaGuatemalaGuineaGuinea-BissauGuyanaHaitiHeavily indebted poor countries (HIPC)High incomeHondurasHong Kong SAR, ChinaHungaryIBRD onlyIcelandIDA & IBRD totalIDA blendIDA onlyIDA totalIndiaIndonesiaIran, Islamic Rep.IraqIrelandIsraelItalyJamaicaJapanJordanKazakhstanKenyaKiribatiKorea, Rep.KosovoKuwaitKyrgyz RepublicLao PDRLate-demographic dividendLatin America & Caribbean Latin America & Caribbean (excluding high income)Latin America & the Caribbean (IDA & IBRD countries)LatviaLeast developed countries: UN classificationLebanonLesothoLiberiaLibyaLithuaniaLow & middle incomeLow incomeLower middle incomeLuxembourgMacao SAR, ChinaMacedonia, FYRMadagascarMalawiMalaysiaMaldivesMaliMaltaMarshall IslandsMauritaniaMauritiusMexicoMicronesia, Fed. Sts.Middle East & North Africa (excluding high income)Middle East & North Africa (IDA & IBRD countries)Middle incomeMoldovaMongoliaMontenegroMoroccoMozambiqueMyanmarNamibiaNepalNetherlandsNew CaledoniaNew ZealandNicaraguaNigerNigeriaNorth AmericaNorwayOECD membersOmanPacific island small statesPakistanPalauPanamaPapua New GuineaParaguayPeruPhilippinesPolandPortugalPost-demographic dividendPre-demographic dividendQatarRomaniaRussian FederationRwandaSamoaSao Tome and PrincipeSaudi ArabiaSenegalSerbiaSeychellesSierra LeoneSingaporeSint Maarten (Dutch part)Slovak RepublicSloveniaSolomon IslandsSouth AfricaSouth AsiaSouth Asia (IDA & IBRD)South SudanSpainSri LankaSt. Kitts and NevisSt. LuciaSt. Vincent and the GrenadinesSub-Saharan Africa Sub-Saharan Africa (excluding high income)Sub-Saharan Africa (IDA & IBRD countries)SudanSurinameSwazilandSwedenSwitzerlandSyrian Arab RepublicTajikistanTanzaniaThailandTimor-LesteTogoTongaTrinidad and TobagoTunisiaTurkeyTuvaluUgandaUkraineUnited KingdomUnited StatesUpper middle incomeUruguayVanuatuVenezuela, RBVietnamWest Bank and GazaWorldYemen, Rep.ZambiaZimbabwe La ligne de temps
Cette échelle de temps montre un graphique de 1985 année à 2016 année Lao PDR. Les données jusqu'à 1984 année ne sont pas présentés. Quantité d'observations actuelles selon dates: 32.
Source (désignation):
Les indicateurs du développement mondiale
Source (organisation):
International Monetary Fund, Balance of Payments Statistics Yearbook and data files.
Catégories:
Economy & Growth, Trade
Dernière mise à jour
23 avr. 2017
Les indicateurs de changement de valeurs selon les années
Minimum:
43.8 mln.
1 janv. 1985
Maximum:
2.769 mds
1 janv. 2016
Pour la date d''observation
Valeur
Changement absolu
Le changement par rapport à la valeur précédente
1 janv. 1985
43.8 mln.
+43.8 mln.
0.0%
1 janv. 1986
53.6 mln.
+9.8 mln.
22.37%
1 janv. 1987
55.0 mln.
+1.4 mln.
2.61%
1 janv. 1988
64.3 mln.
+9.3 mln.
16.91%
1 janv. 1989
57.8 mln.
-6.5 mln.
-10.11%
1 janv. 1990
63.3 mln.
+5.5 mln.
9.52%
1 janv. 1991
78.7 mln.
+15.4 mln.
24.33%
1 janv. 1992
96.6 mln.
+17.9 mln.
22.74%
1 janv. 1993
132.6 mln.
+36.0 mln.
37.27%
1 janv. 1994
162.9 mln.
+30.3 mln.
22.85%
1 janv. 1995
201.1 mln.
+38.2 mln.
23.45%
1 janv. 1996
216.5 mln.
+15.4 mln.
7.66%
1 janv. 1997
246.2 mln.
+29.7 mln.
13.72%
1 janv. 1998
188.6 mln.
-57.6 mln.
-23.4%
1 janv. 1999
187.6 mln.
-1000.0 milles
-0.53%
1 janv. 2000
162.8 mln.
-24.8 mln.
-13.22%
1 janv. 2001
330.31 mln.
+167.51 mln.
102.89%
1 janv. 2002
319.516 mln.
-10.794 mln.
-3.27%
1 janv. 2003
300.618 mln.
-18.898 mln.
-5.91%
1 janv. 2004
335.467 mln.
+34.849 mln.
11.59%
1 janv. 2005
363.347 mln.
+27.881 mln.
8.31%
1 janv. 2006
553.079 mln.
+189.732 mln.
52.22%
1 janv. 2007
882.028 mln.
+328.949 mln.
59.48%
1 janv. 2008
922.692 mln.
+40.665 mln.
4.61%
1 janv. 2009
1.092 mds
+169.216 mln.
18.34%
1 janv. 2010
1.053 mds
-39.233 mln.
-3.59%
1 janv. 2011
1.746 mds
+693.729 mln.
65.9%
1 janv. 2012
1.854 mds
+107.573 mln.
6.16%
1 janv. 2013
2.271 mds
+416.696 mln.
22.48%
1 janv. 2014
2.264 mds
-6.747 mln.
-0.3%
1 janv. 2015
2.662 mds
+398.095 mln.
17.58%
1 janv. 2016
2.769 mds
+106.965 mln.
4.02%
Classement des pays selon les statistiques actuelles par années


Commentaires: