30
/fr/
AIzaSyAYiBZKx7MnpbEhh9jyipgxe19OcubqV5w
April 1, 2024
168652
Kiribati
KIR
true
2
1
Goods exports (BoP, current US$)
2015,2014,2013,2012,2011,2010,2009,2008,2007,1995,1994,1993,1992,1991,1990,1989,1988,1987,1986,1985,1984,1983,1982,1981,1980
Download
Bibliothèque de statistiques globales →Kiribati →

Goods exports (BoP, current US$)

Cette statistique dans les autres pays:

AfghanistanAlbaniaAlgeriaAngolaAntigua and BarbudaArab WorldArgentinaArmeniaArubaAustraliaAustriaAzerbaijanBahamas, TheBahrainBangladeshBarbadosBelarusBelgiumBelizeBeninBermudaBhutanBoliviaBosnia and HerzegovinaBotswanaBrazilBrunei DarussalamBulgariaBurkina FasoBurundiCabo VerdeCambodiaCameroonCanadaCaribbean small statesCentral African RepublicCentral Europe and the BalticsChadChileChinaColombiaComorosCongo, Dem. Rep.Congo, Rep.Costa RicaCote d'IvoireCroatiaCuracaoCyprusCzech RepublicDenmarkDjiboutiDominicaDominican RepublicEarly-demographic dividendEast Asia & PacificEast Asia & Pacific (excluding high income)East Asia & Pacific (IDA & IBRD countries)EcuadorEgypt, Arab Rep.El SalvadorEquatorial GuineaEritreaEstoniaEthiopiaEuro areaEurope & Central AsiaEurope & Central Asia (excluding high income)Europe & Central Asia (IDA & IBRD countries)European UnionFaroe IslandsFijiFinlandFragile and conflict affected situationsFranceFrench PolynesiaGabonGambia, TheGeorgiaGermanyGhanaGreeceGrenadaGuatemalaGuineaGuinea-BissauGuyanaHaitiHeavily indebted poor countries (HIPC)High incomeHondurasHong Kong SAR, ChinaHungaryIBRD onlyIcelandIDA & IBRD totalIDA blendIDA onlyIDA totalIndiaIndonesiaIran, Islamic Rep.IraqIrelandIsraelItalyJamaicaJapanJordanKazakhstanKenyaKiribatiKorea, Rep.KosovoKuwaitKyrgyz RepublicLao PDRLate-demographic dividendLatin America & Caribbean Latin America & Caribbean (excluding high income)Latin America & the Caribbean (IDA & IBRD countries)LatviaLeast developed countries: UN classificationLebanonLesothoLiberiaLibyaLithuaniaLow & middle incomeLow incomeLower middle incomeLuxembourgMacao SAR, ChinaMacedonia, FYRMadagascarMalawiMalaysiaMaldivesMaliMaltaMarshall IslandsMauritaniaMauritiusMexicoMicronesia, Fed. Sts.Middle East & North Africa (excluding high income)Middle East & North Africa (IDA & IBRD countries)Middle incomeMoldovaMongoliaMontenegroMoroccoMozambiqueMyanmarNamibiaNepalNetherlandsNew CaledoniaNew ZealandNicaraguaNigerNigeriaNorth AmericaNorwayOECD membersOmanPacific island small statesPakistanPalauPanamaPapua New GuineaParaguayPeruPhilippinesPolandPortugalPost-demographic dividendPre-demographic dividendQatarRomaniaRussian FederationRwandaSamoaSao Tome and PrincipeSaudi ArabiaSenegalSerbiaSeychellesSierra LeoneSingaporeSint Maarten (Dutch part)Slovak RepublicSloveniaSolomon IslandsSouth AfricaSouth AsiaSouth Asia (IDA & IBRD)South SudanSpainSri LankaSt. Kitts and NevisSt. LuciaSt. Vincent and the GrenadinesSub-Saharan Africa Sub-Saharan Africa (excluding high income)Sub-Saharan Africa (IDA & IBRD countries)SudanSurinameSwazilandSwedenSwitzerlandSyrian Arab RepublicTajikistanTanzaniaThailandTimor-LesteTogoTongaTrinidad and TobagoTunisiaTurkeyTuvaluUgandaUkraineUnited KingdomUnited StatesUpper middle incomeUruguayVanuatuVenezuela, RBVietnamWest Bank and GazaWorldYemen, Rep.ZambiaZimbabwe

La ligne de temps

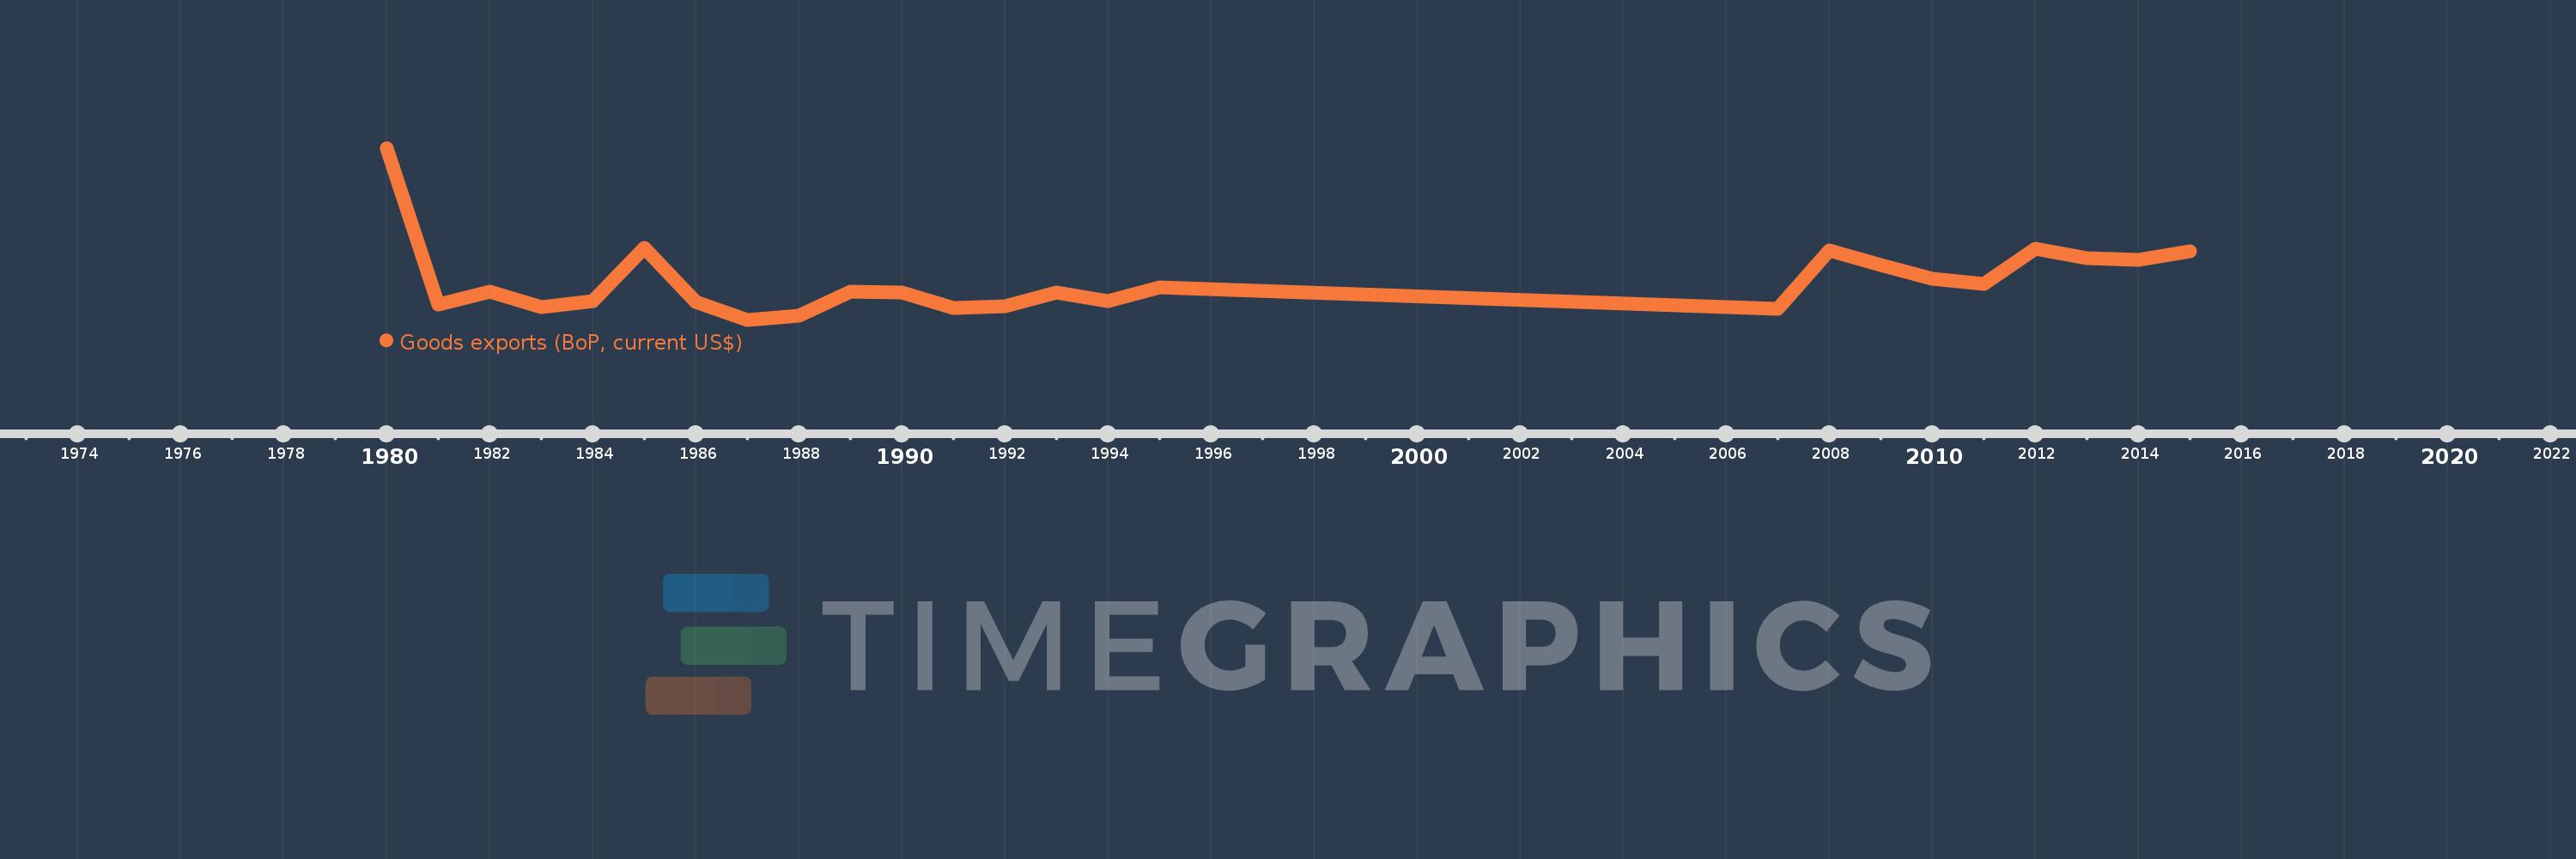
Cette échelle de temps montre un graphique de 1980 année à 2015 année Kiribati. Les données jusqu'à 1979 année ne sont pas présentés. Quantité d'observations actuelles selon dates: 25.

Source (désignation):

Les indicateurs du développement mondiale

Source (organisation):

International Monetary Fund, Balance of Payments Statistics Yearbook and data files.

Catégories:

Economy & Growth, Trade

Dernière mise à jour

23 avr. 2017

Les indicateurs de changement de valeurs selon les années

En moyenne:
7.071 mln.
Minimum:
1.775 mln.
1 janv. 1987
Maximum:
25.193 mln.
1 janv. 1980
Pour la date d''observation
Valeur
Changement absolu
Le changement par rapport à la valeur précédente
1 janv. 1980
25.193 mln.
+25.193 mln.
0.0%
1 janv. 1981
3.871 mln.
-21.322 mln.
-84.63%
1 janv. 1982
5.576 mln.
+1.704 mln.
44.02%
1 janv. 1983
3.438 mln.
-2.138 mln.
-38.35%
1 janv. 1984
4.266 mln.
+828.11 milles
24.09%
1 janv. 1985
11.602 mln.
+7.337 mln.
171.99%
1 janv. 1986
4.257 mln.
-7.346 mln.
-63.31%
1 janv. 1987
1.775 mln.
-2.482 mln.
-58.31%
1 janv. 1988
2.288 mln.
+512.764 milles
28.89%
1 janv. 1989
5.593 mln.
+3.306 mln.
144.52%
1 janv. 1990
5.507 mln.
-86.475 milles
-1.55%
1 janv. 1991
3.342 mln.
-2.165 mln.
-39.32%
1 janv. 1992
3.632 mln.
+289.759 milles
8.67%
1 janv. 1993
5.518 mln.
+1.886 mln.
51.94%
1 janv. 1994
4.282 mln.
-1.236 mln.
-22.39%
1 janv. 1995
6.149 mln.
+1.867 mln.
43.59%
1 janv. 2007
3.272 mln.
-2.877 mln.
-46.79%
1 janv. 2008
11.262 mln.
+7.991 mln.
244.24%
1 janv. 2009
9.179 mln.
-2.083 mln.
-18.5%
1 janv. 2010
7.416 mln.
-1.763 mln.
-19.21%
1 janv. 2011
6.658 mln.
-757.961 milles
-10.22%
1 janv. 2012
11.477 mln.
+4.819 mln.
72.38%
1 janv. 2013
10.19 mln.
-1.287 mln.
-11.21%
1 janv. 2014
9.942 mln.
-248.25 milles
-2.44%
1 janv. 2015
11.082 mln.
+1.14 mln.
11.47%

Classement des pays selon les statistiques actuelles par années