30
/fr/
AIzaSyAYiBZKx7MnpbEhh9jyipgxe19OcubqV5w
April 1, 2024
108546
Comoros
COM
true
2
1
Goods exports (BoP, current US$)
2013,2012,2011,2010,2009,2008,2007,2006,2005,2004,1996,1995,1994,1993,1992,1991,1990,1989,1988,1987,1986,1985,1984,1983,1982,1981
Download
Bibliothèque de statistiques globales →Comoros →

Goods exports (BoP, current US$)

Cette statistique dans les autres pays:

AfghanistanAlbaniaAlgeriaAngolaAntigua and BarbudaArab WorldArgentinaArmeniaArubaAustraliaAustriaAzerbaijanBahamas, TheBahrainBangladeshBarbadosBelarusBelgiumBelizeBeninBermudaBhutanBoliviaBosnia and HerzegovinaBotswanaBrazilBrunei DarussalamBulgariaBurkina FasoBurundiCabo VerdeCambodiaCameroonCanadaCaribbean small statesCentral African RepublicCentral Europe and the BalticsChadChileChinaColombiaComorosCongo, Dem. Rep.Congo, Rep.Costa RicaCote d'IvoireCroatiaCuracaoCyprusCzech RepublicDenmarkDjiboutiDominicaDominican RepublicEarly-demographic dividendEast Asia & PacificEast Asia & Pacific (excluding high income)East Asia & Pacific (IDA & IBRD countries)EcuadorEgypt, Arab Rep.El SalvadorEquatorial GuineaEritreaEstoniaEthiopiaEuro areaEurope & Central AsiaEurope & Central Asia (excluding high income)Europe & Central Asia (IDA & IBRD countries)European UnionFaroe IslandsFijiFinlandFragile and conflict affected situationsFranceFrench PolynesiaGabonGambia, TheGeorgiaGermanyGhanaGreeceGrenadaGuatemalaGuineaGuinea-BissauGuyanaHaitiHeavily indebted poor countries (HIPC)High incomeHondurasHong Kong SAR, ChinaHungaryIBRD onlyIcelandIDA & IBRD totalIDA blendIDA onlyIDA totalIndiaIndonesiaIran, Islamic Rep.IraqIrelandIsraelItalyJamaicaJapanJordanKazakhstanKenyaKiribatiKorea, Rep.KosovoKuwaitKyrgyz RepublicLao PDRLate-demographic dividendLatin America & Caribbean Latin America & Caribbean (excluding high income)Latin America & the Caribbean (IDA & IBRD countries)LatviaLeast developed countries: UN classificationLebanonLesothoLiberiaLibyaLithuaniaLow & middle incomeLow incomeLower middle incomeLuxembourgMacao SAR, ChinaMacedonia, FYRMadagascarMalawiMalaysiaMaldivesMaliMaltaMarshall IslandsMauritaniaMauritiusMexicoMicronesia, Fed. Sts.Middle East & North Africa (excluding high income)Middle East & North Africa (IDA & IBRD countries)Middle incomeMoldovaMongoliaMontenegroMoroccoMozambiqueMyanmarNamibiaNepalNetherlandsNew CaledoniaNew ZealandNicaraguaNigerNigeriaNorth AmericaNorwayOECD membersOmanPacific island small statesPakistanPalauPanamaPapua New GuineaParaguayPeruPhilippinesPolandPortugalPost-demographic dividendPre-demographic dividendQatarRomaniaRussian FederationRwandaSamoaSao Tome and PrincipeSaudi ArabiaSenegalSerbiaSeychellesSierra LeoneSingaporeSint Maarten (Dutch part)Slovak RepublicSloveniaSolomon IslandsSouth AfricaSouth AsiaSouth Asia (IDA & IBRD)South SudanSpainSri LankaSt. Kitts and NevisSt. LuciaSt. Vincent and the GrenadinesSub-Saharan Africa Sub-Saharan Africa (excluding high income)Sub-Saharan Africa (IDA & IBRD countries)SudanSurinameSwazilandSwedenSwitzerlandSyrian Arab RepublicTajikistanTanzaniaThailandTimor-LesteTogoTongaTrinidad and TobagoTunisiaTurkeyTuvaluUgandaUkraineUnited KingdomUnited StatesUpper middle incomeUruguayVanuatuVenezuela, RBVietnamWest Bank and GazaWorldYemen, Rep.ZambiaZimbabwe

La ligne de temps

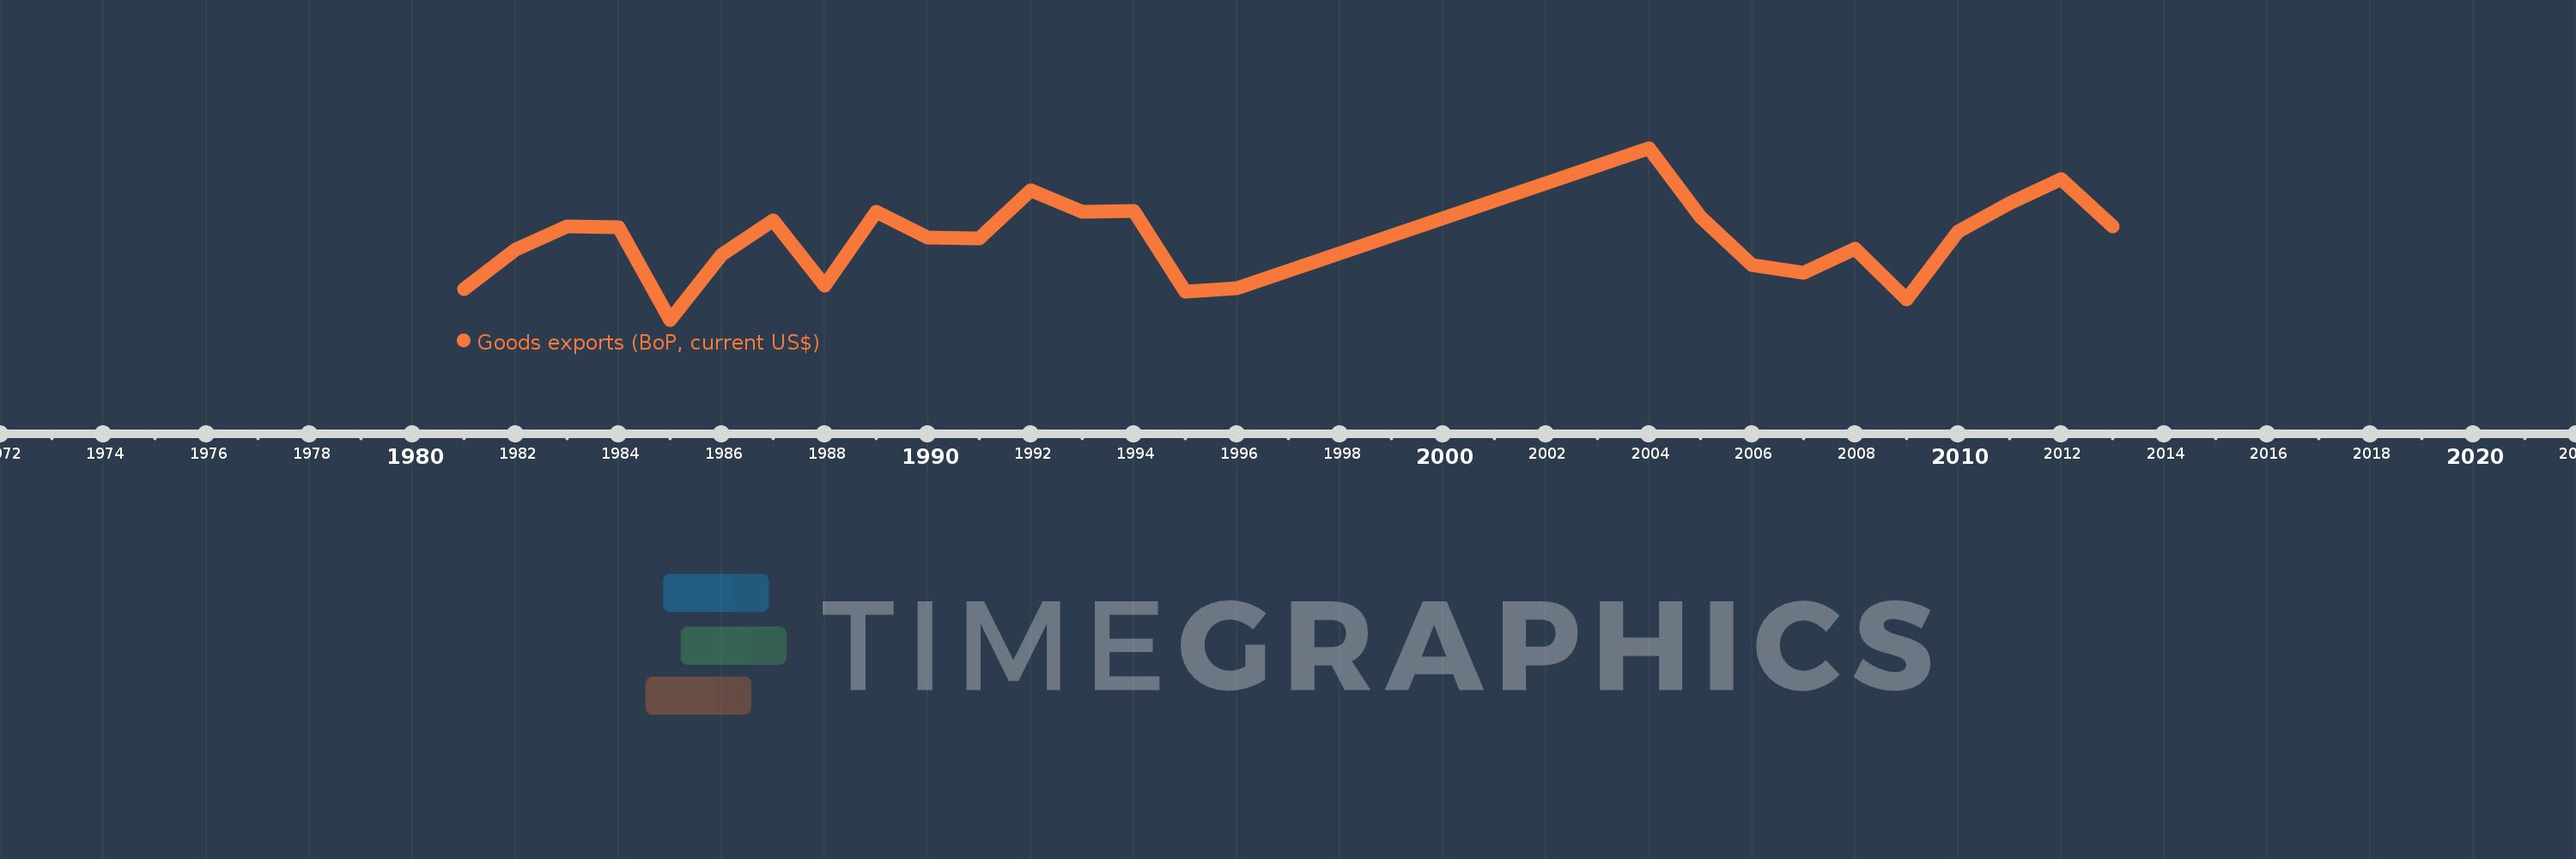
Cette échelle de temps montre un graphique de 1981 année à 2013 année Comoros. Les données jusqu'à 1980 année ne sont pas présentés. Quantité d'observations actuelles selon dates: 26.

Source (désignation):

Les indicateurs du développement mondiale

Source (organisation):

International Monetary Fund, Balance of Payments Statistics Yearbook and data files.

Catégories:

Economy & Growth, Trade

Dernière mise à jour

23 avr. 2017

Les indicateurs de changement de valeurs selon les années

En moyenne:
17.687 mln.
Minimum:
7.047 mln.
1 janv. 1985
Maximum:
30.011 mln.
1 janv. 2004
Pour la date d''observation
Valeur
Changement absolu
Le changement par rapport à la valeur précédente
1 janv. 1981
11.189 mln.
+11.189 mln.
0.0%
1 janv. 1982
16.417 mln.
+5.228 mln.
46.72%
1 janv. 1983
19.583 mln.
+3.166 mln.
19.28%
1 janv. 1984
19.469 mln.
-113.642 milles
-0.58%
1 janv. 1985
7.047 mln.
-12.423 mln.
-63.81%
1 janv. 1986
15.688 mln.
+8.642 mln.
122.64%
1 janv. 1987
20.367 mln.
+4.679 mln.
29.82%
1 janv. 1988
11.599 mln.
-8.767 mln.
-43.05%
1 janv. 1989
21.481 mln.
+9.882 mln.
85.19%
1 janv. 1990
18.05 mln.
-3.431 mln.
-15.97%
1 janv. 1991
17.935 mln.
-114.941 milles
-0.64%
1 janv. 1992
24.356 mln.
+6.421 mln.
35.8%
1 janv. 1993
21.429 mln.
-2.927 mln.
-12.02%
1 janv. 1994
21.581 mln.
+152.547 milles
0.71%
1 janv. 1995
10.785 mln.
-10.796 mln.
-50.02%
1 janv. 1996
11.315 mln.
+530.066 milles
4.91%
1 janv. 2004
30.011 mln.
+18.696 mln.
165.23%
1 janv. 2005
20.804 mln.
-9.207 mln.
-30.68%
1 janv. 2006
14.386 mln.
-6.419 mln.
-30.85%
1 janv. 2007
13.313 mln.
-1.073 mln.
-7.46%
1 janv. 2008
16.494 mln.
+3.181 mln.
23.89%
1 janv. 2009
9.814 mln.
-6.68 mln.
-40.5%
1 janv. 2010
18.875 mln.
+9.061 mln.
92.32%
1 janv. 2011
22.576 mln.
+3.701 mln.
19.61%
1 janv. 2012
25.794 mln.
+3.218 mln.
14.25%
1 janv. 2013
19.507 mln.
-6.286 mln.
-24.37%

Classement des pays selon les statistiques actuelles par années