29
/fr/
fr
AIzaSyAYiBZKx7MnpbEhh9jyipgxe19OcubqV5w
April 1, 2024
284415
Yemen, Rep.
YEM
true
2
1
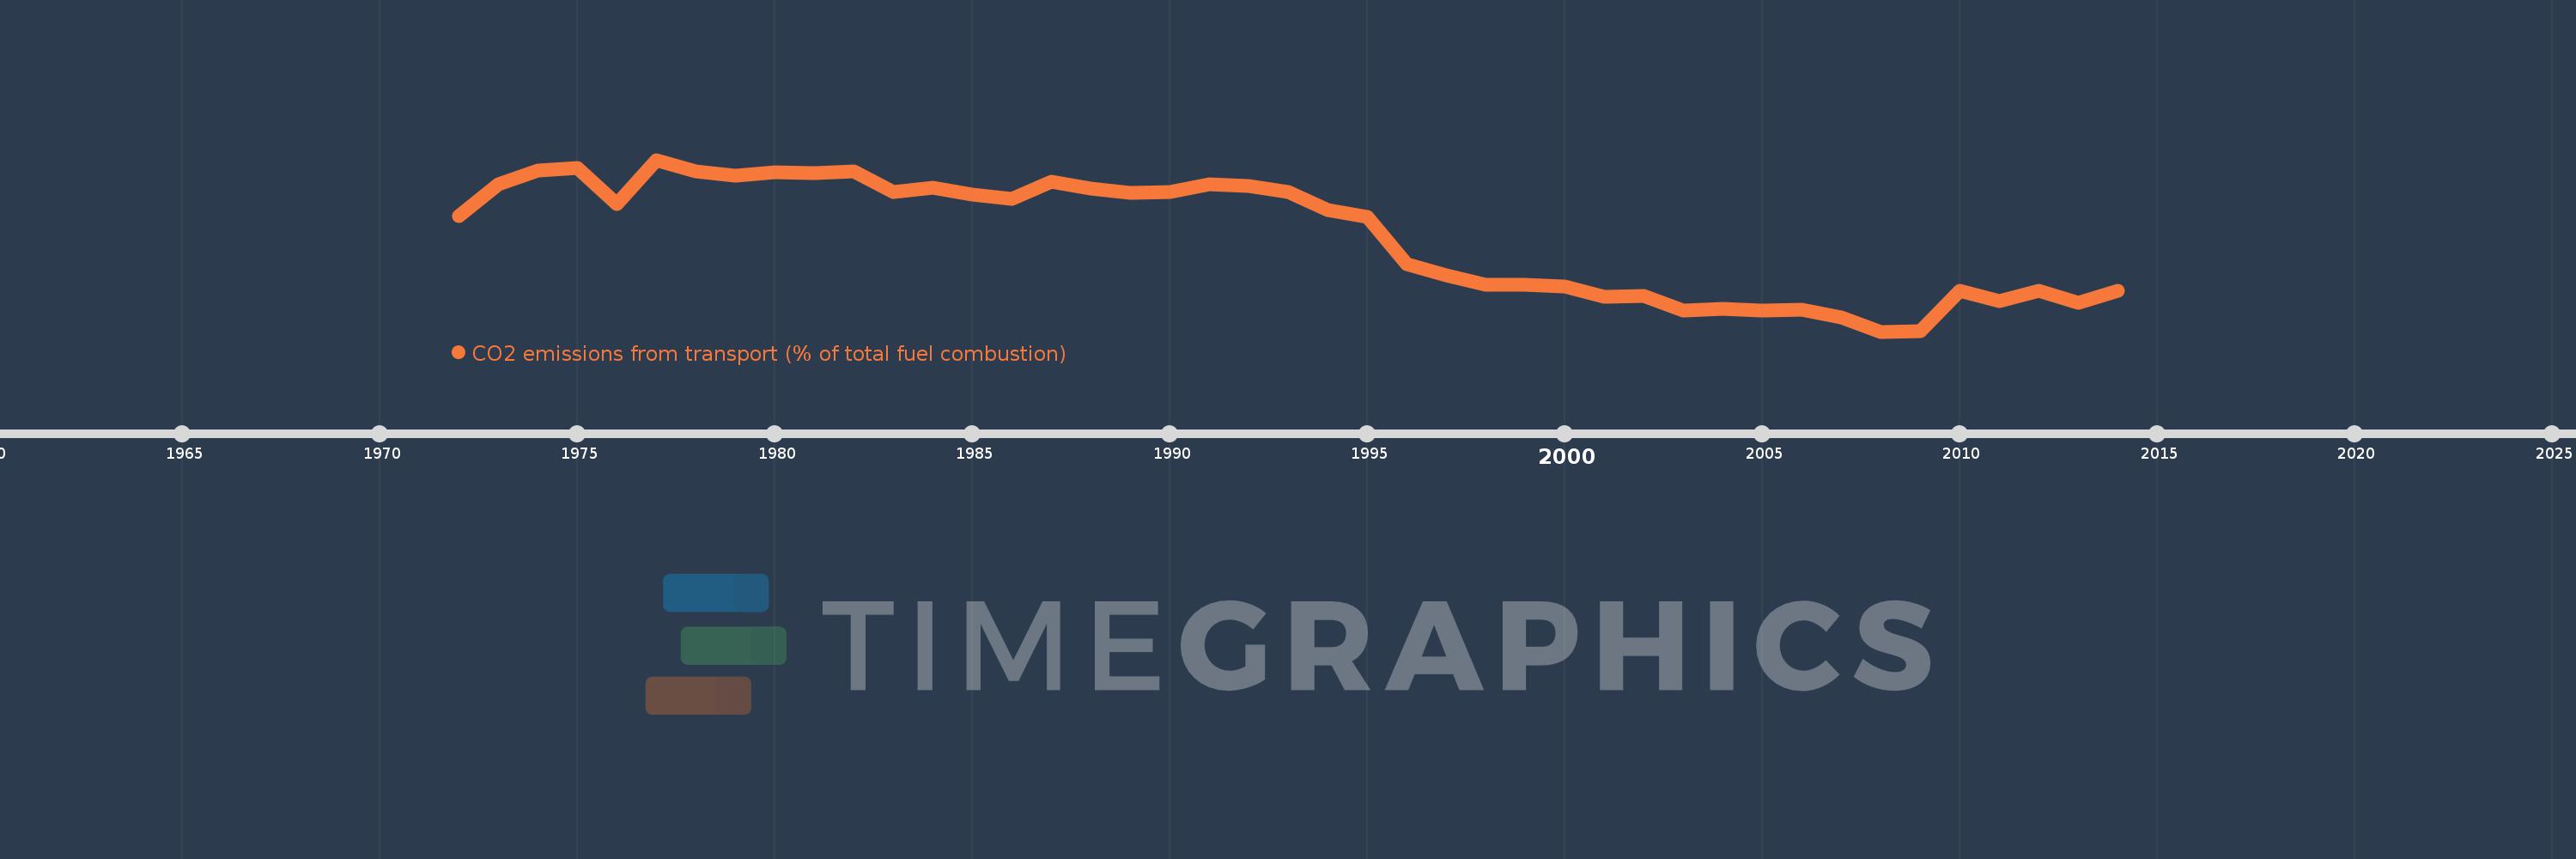
CO2 emissions from transport (% of total fuel combustion)
2014,2013,2012,2011,2010,2009,2008,2007,2006,2005,2004,2003,2002,2001,2000,1999,1998,1997,1996,1995,1994,1993,1992,1991,1990,1989,1988,1987,1986,1985,1984,1983,1982,1981,1980,1979,1978,1977,1976,1975,1974,1973,1972
Cette statistique dans les autres pays:
AlbaniaAlgeriaAngolaArab WorldArgentinaArmeniaAustraliaAustriaAzerbaijanBahrainBangladeshBelarusBelgiumBeninBoliviaBosnia and HerzegovinaBotswanaBrazilBrunei DarussalamBulgariaCambodiaCameroonCanadaCaribbean small statesCentral Europe and the BalticsChileChinaColombiaCongo, Dem. Rep.Congo, Rep.Costa RicaCote d'IvoireCroatiaCubaCuracaoCyprusCzech RepublicDenmarkDominican RepublicEarly-demographic dividendEast Asia & PacificEast Asia & Pacific (excluding high income)East Asia & Pacific (IDA & IBRD countries)EcuadorEgypt, Arab Rep.El SalvadorEritreaEstoniaEthiopiaEuro areaEurope & Central AsiaEurope & Central Asia (excluding high income)Europe & Central Asia (IDA & IBRD countries)European UnionFinlandFragile and conflict affected situationsFranceGabonGeorgiaGermanyGhanaGibraltarGreeceGuatemalaHaitiHeavily indebted poor countries (HIPC)High incomeHondurasHong Kong SAR, ChinaHungaryIBRD onlyIcelandIDA & IBRD totalIDA blendIDA onlyIDA totalIndiaIndonesiaIran, Islamic Rep.IraqIrelandIsraelItalyJamaicaJapanJordanKazakhstanKenyaKorea, Dem. People’s Rep.Korea, Rep.KosovoKuwaitKyrgyz RepublicLate-demographic dividendLatin America & Caribbean Latin America & Caribbean (excluding high income)Latin America & the Caribbean (IDA & IBRD countries)LatviaLeast developed countries: UN classificationLebanonLibyaLithuaniaLow & middle incomeLow incomeLower middle incomeLuxembourgMacedonia, FYRMalaysiaMaltaMauritiusMexicoMiddle East & North AfricaMiddle East & North Africa (excluding high income)Middle East & North Africa (IDA & IBRD countries)Middle incomeMoldovaMongoliaMontenegroMoroccoMozambiqueMyanmarNamibiaNepalNetherlandsNew ZealandNicaraguaNigerNigeriaNorth AmericaNorwayOECD membersOmanOther small statesPakistanPanamaParaguayPeruPhilippinesPolandPortugalPost-demographic dividendPre-demographic dividendQatarRomaniaRussian FederationSaudi ArabiaSenegalSerbiaSingaporeSlovak RepublicSloveniaSmall statesSouth AfricaSouth AsiaSouth Asia (IDA & IBRD)South SudanSpainSri LankaSub-Saharan Africa Sub-Saharan Africa (excluding high income)Sub-Saharan Africa (IDA & IBRD countries)SudanSwedenSwitzerlandSyrian Arab RepublicTajikistanTanzaniaThailandTogoTrinidad and TobagoTunisiaTurkeyTurkmenistanUkraineUnited Arab EmiratesUnited KingdomUnited StatesUpper middle incomeUruguayUzbekistanVenezuela, RBVietnamWorldYemen, Rep.ZambiaZimbabwe La ligne de temps
Cette échelle de temps montre un graphique de 1972 année à 2014 année Yemen, Rep.. Les données jusqu'à 1971 année ne sont pas présentés. Quantité d'observations actuelles selon dates: 43.
Source (désignation):
Les indicateurs du développement mondiale
Source (organisation):
IEA Statistics © OECD/IEA 2014 (http://www.iea.org/stats/index.asp), subject to https://www.iea.org/t&c/termsandconditions/
Catégories:
Environment
Dernière mise à jour
23 avr. 2017
Les indicateurs de changement de valeurs selon les années
Maximum:
70.183
1 janv. 1977
Pour la date d''observation
Valeur
Changement absolu
Le changement par rapport à la valeur précédente
1 janv. 1972
55.0
+55.0
0.0%
1 janv. 1973
63.448
+8.448
15.36%
1 janv. 1974
67.204
+3.756
5.92%
1 janv. 1975
67.935
+0.73
1.09%
1 janv. 1976
58.286
-9.649
-14.2%
1 janv. 1977
70.183
+11.898
20.41%
1 janv. 1978
67.123
-3.06
-4.36%
1 janv. 1979
65.984
-1.14
-1.7%
1 janv. 1980
66.92
+0.937
1.42%
1 janv. 1981
66.667
-0.253
-0.38%
1 janv. 1982
67.143
+0.476
0.71%
1 janv. 1983
61.404
-5.739
-8.55%
1 janv. 1984
62.67
+1.266
2.06%
1 janv. 1985
60.841
-1.829
-2.92%
1 janv. 1986
59.671
-1.17
-1.92%
1 janv. 1987
64.202
+4.532
7.59%
1 janv. 1988
62.411
-1.791
-2.79%
1 janv. 1989
61.248
-1.163
-1.86%
1 janv. 1990
61.356
+0.109
0.18%
1 janv. 1991
63.651
+2.294
3.74%
1 janv. 1992
63.022
-0.629
-0.99%
1 janv. 1993
61.477
-1.545
-2.45%
1 janv. 1994
56.611
-4.866
-7.92%
1 janv. 1995
54.601
-2.01
-3.55%
1 janv. 1996
41.994
-12.608
-23.09%
1 janv. 1997
38.883
-3.11
-7.41%
1 janv. 1998
36.39
-2.493
-6.41%
1 janv. 1999
36.234
-0.156
-0.43%
1 janv. 2000
35.794
-0.441
-1.22%
1 janv. 2001
32.984
-2.81
-7.85%
1 janv. 2002
33.356
+0.373
1.13%
1 janv. 2003
29.19
-4.167
-12.49%
1 janv. 2004
29.869
+0.68
2.33%
1 janv. 2005
29.26
-0.609
-2.04%
1 janv. 2006
29.58
+0.32
1.09%
1 janv. 2007
27.369
-2.211
-7.48%
1 janv. 2008
23.6
-3.769
-13.77%
1 janv. 2009
23.718
+0.118
0.5%
1 janv. 2010
34.696
+10.978
46.29%
1 janv. 2011
31.863
-2.833
-8.16%
1 janv. 2012
34.651
+2.789
8.75%
1 janv. 2013
31.458
-3.193
-9.22%
1 janv. 2014
34.741
+3.283
10.44%
Classement des pays selon les statistiques actuelles par années


Commentaires: