29
/fr/
fr
AIzaSyAYiBZKx7MnpbEhh9jyipgxe19OcubqV5w
April 1, 2024
264351
Togo
TGO
true
2
1
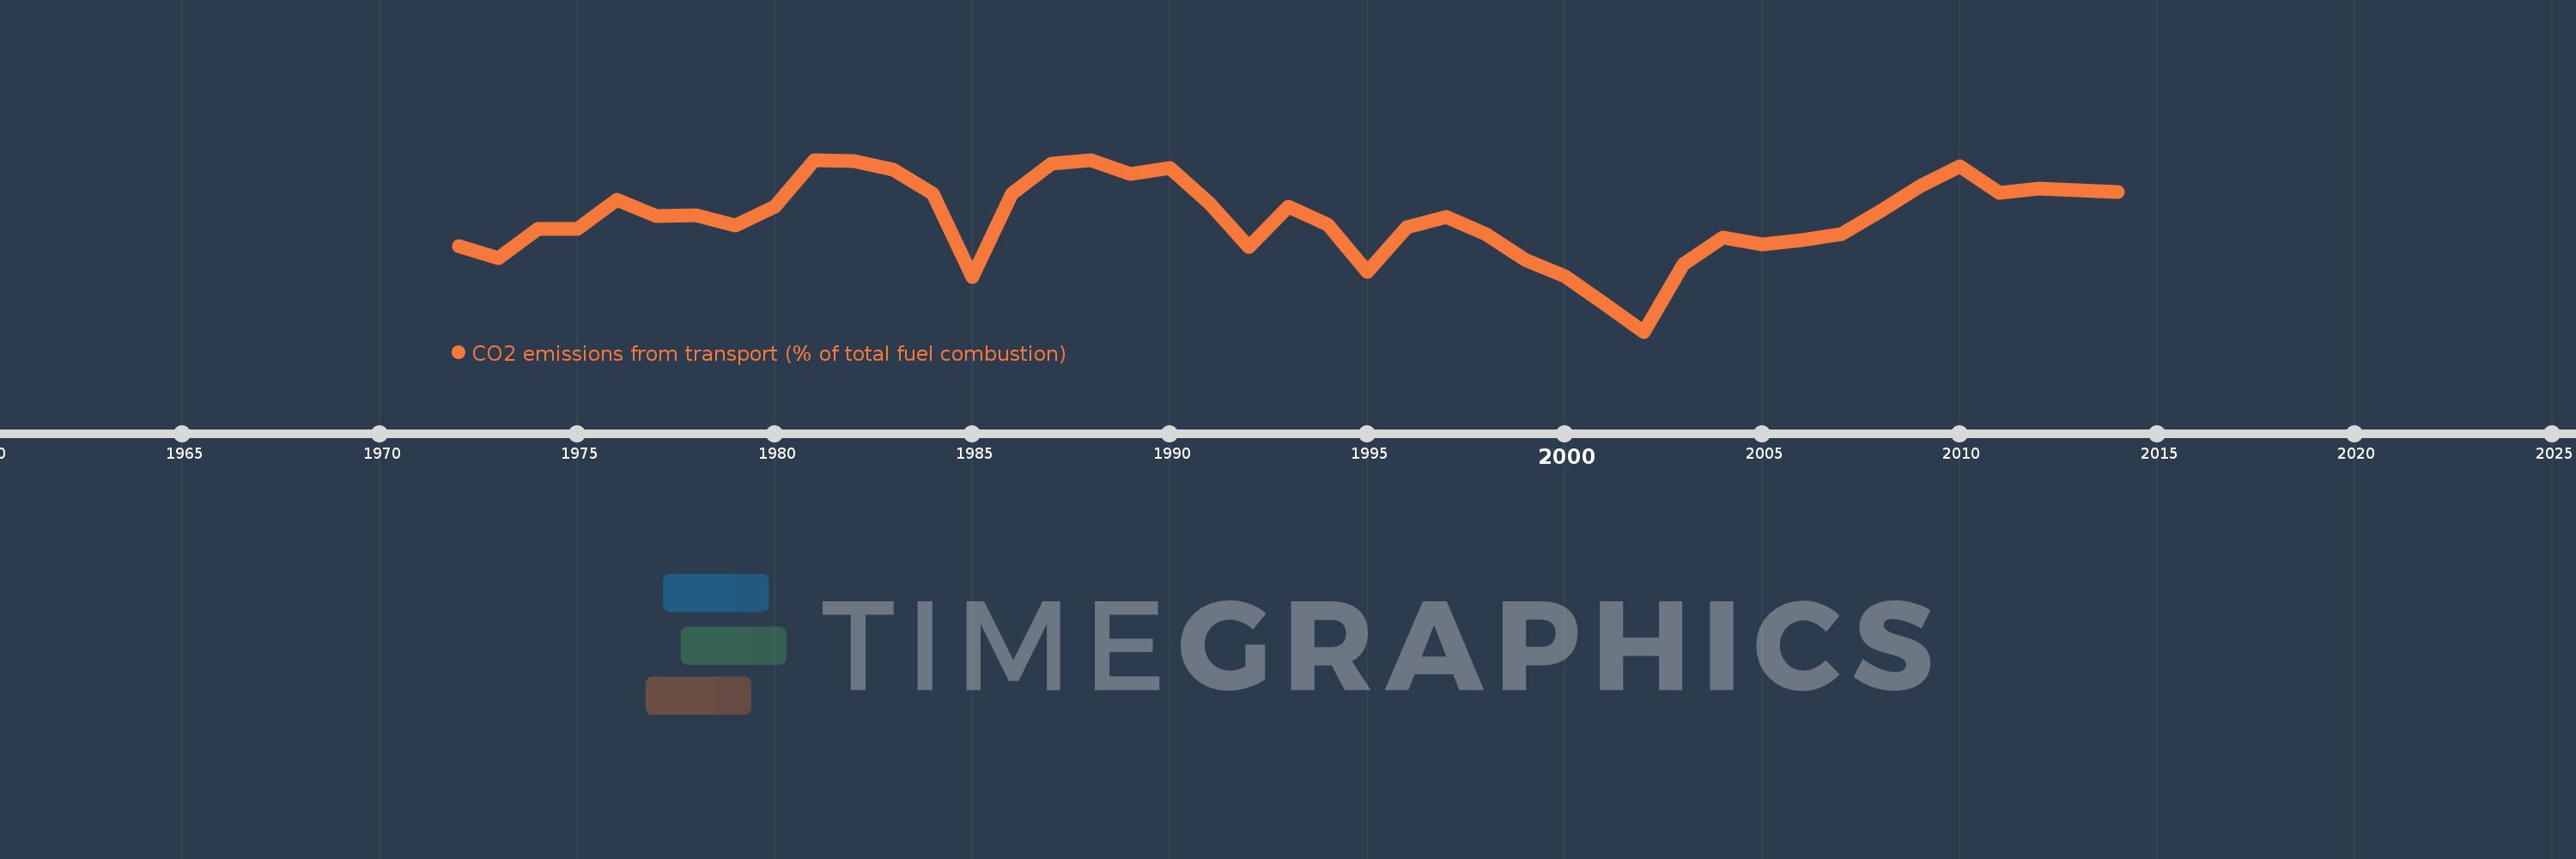
CO2 emissions from transport (% of total fuel combustion)
2014,2013,2012,2011,2010,2009,2008,2007,2006,2005,2004,2003,2002,2001,2000,1999,1998,1997,1996,1995,1994,1993,1992,1991,1990,1989,1988,1987,1986,1985,1984,1983,1982,1981,1980,1979,1978,1977,1976,1975,1974,1973,1972
Cette statistique dans les autres pays:
AlbaniaAlgeriaAngolaArab WorldArgentinaArmeniaAustraliaAustriaAzerbaijanBahrainBangladeshBelarusBelgiumBeninBoliviaBosnia and HerzegovinaBotswanaBrazilBrunei DarussalamBulgariaCambodiaCameroonCanadaCaribbean small statesCentral Europe and the BalticsChileChinaColombiaCongo, Dem. Rep.Congo, Rep.Costa RicaCote d'IvoireCroatiaCubaCuracaoCyprusCzech RepublicDenmarkDominican RepublicEarly-demographic dividendEast Asia & PacificEast Asia & Pacific (excluding high income)East Asia & Pacific (IDA & IBRD countries)EcuadorEgypt, Arab Rep.El SalvadorEritreaEstoniaEthiopiaEuro areaEurope & Central AsiaEurope & Central Asia (excluding high income)Europe & Central Asia (IDA & IBRD countries)European UnionFinlandFragile and conflict affected situationsFranceGabonGeorgiaGermanyGhanaGibraltarGreeceGuatemalaHaitiHeavily indebted poor countries (HIPC)High incomeHondurasHong Kong SAR, ChinaHungaryIBRD onlyIcelandIDA & IBRD totalIDA blendIDA onlyIDA totalIndiaIndonesiaIran, Islamic Rep.IraqIrelandIsraelItalyJamaicaJapanJordanKazakhstanKenyaKorea, Dem. People’s Rep.Korea, Rep.KosovoKuwaitKyrgyz RepublicLate-demographic dividendLatin America & Caribbean Latin America & Caribbean (excluding high income)Latin America & the Caribbean (IDA & IBRD countries)LatviaLeast developed countries: UN classificationLebanonLibyaLithuaniaLow & middle incomeLow incomeLower middle incomeLuxembourgMacedonia, FYRMalaysiaMaltaMauritiusMexicoMiddle East & North AfricaMiddle East & North Africa (excluding high income)Middle East & North Africa (IDA & IBRD countries)Middle incomeMoldovaMongoliaMontenegroMoroccoMozambiqueMyanmarNamibiaNepalNetherlandsNew ZealandNicaraguaNigerNigeriaNorth AmericaNorwayOECD membersOmanOther small statesPakistanPanamaParaguayPeruPhilippinesPolandPortugalPost-demographic dividendPre-demographic dividendQatarRomaniaRussian FederationSaudi ArabiaSenegalSerbiaSingaporeSlovak RepublicSloveniaSmall statesSouth AfricaSouth AsiaSouth Asia (IDA & IBRD)South SudanSpainSri LankaSub-Saharan Africa Sub-Saharan Africa (excluding high income)Sub-Saharan Africa (IDA & IBRD countries)SudanSwedenSwitzerlandSyrian Arab RepublicTajikistanTanzaniaThailandTogoTrinidad and TobagoTunisiaTurkeyTurkmenistanUkraineUnited Arab EmiratesUnited KingdomUnited StatesUpper middle incomeUruguayUzbekistanVenezuela, RBVietnamWorldYemen, Rep.ZambiaZimbabwe La ligne de temps
Cette échelle de temps montre un graphique de 1972 année à 2014 année Togo. Les données jusqu'à 1971 année ne sont pas présentés. Quantité d'observations actuelles selon dates: 43.
Source (désignation):
Les indicateurs du développement mondiale
Source (organisation):
IEA Statistics © OECD/IEA 2014 (http://www.iea.org/stats/index.asp), subject to https://www.iea.org/t&c/termsandconditions/
Catégories:
Environment
Dernière mise à jour
23 avr. 2017
Les indicateurs de changement de valeurs selon les années
Minimum:
37.179
1 janv. 2002
Maximum:
86.538
1 janv. 1988
Pour la date d''observation
Valeur
Changement absolu
Le changement par rapport à la valeur précédente
1 janv. 1972
61.765
+61.765
0.0%
1 janv. 1973
58.333
-3.431
-5.56%
1 janv. 1974
66.667
+8.333
14.29%
1 janv. 1975
66.667
0.0
0.0%
1 janv. 1976
75.0
+8.333
12.5%
1 janv. 1977
70.37
-4.63
-6.17%
1 janv. 1978
70.588
+0.218
0.31%
1 janv. 1979
67.647
-2.941
-4.17%
1 janv. 1980
73.171
+5.524
8.17%
1 janv. 1981
86.486
+13.316
18.2%
1 janv. 1982
86.111
-0.375
-0.43%
1 janv. 1983
83.721
-2.39
-2.78%
1 janv. 1984
76.667
-7.054
-8.43%
1 janv. 1985
52.941
-23.725
-30.95%
1 janv. 1986
76.667
+23.725
44.81%
1 janv. 1987
85.417
+8.75
11.41%
1 janv. 1988
86.538
+1.122
1.31%
1 janv. 1989
82.353
-4.186
-4.84%
1 janv. 1990
84.314
+1.961
2.38%
1 janv. 1991
74.138
-10.176
-12.07%
1 janv. 1992
61.538
-12.599
-16.99%
1 janv. 1993
72.973
+11.435
18.58%
1 janv. 1994
68.0
-4.973
-6.81%
1 janv. 1995
54.237
-13.763
-20.24%
1 janv. 1996
67.241
+13.004
23.98%
1 janv. 1997
70.213
+2.971
4.42%
1 janv. 1998
65.152
-5.061
-7.21%
1 janv. 1999
57.831
-7.32
-11.24%
1 janv. 2000
53.211
-4.62
-7.99%
1 janv. 2001
45.263
-7.948
-14.94%
1 janv. 2002
37.179
-8.084
-17.86%
1 janv. 2003
56.471
+19.291
51.89%
1 janv. 2004
64.22
+7.75
13.72%
1 janv. 2005
62.136
-2.084
-3.25%
1 janv. 2006
63.542
+1.406
2.26%
1 janv. 2007
65.169
+1.627
2.56%
1 janv. 2008
71.91
+6.742
10.34%
1 janv. 2009
79.091
+7.181
9.99%
1 janv. 2010
84.649
+5.558
7.03%
1 janv. 2011
76.923
-7.726
-9.13%
1 janv. 2012
78.307
+1.384
1.8%
1 janv. 2013
77.778
-0.529
-0.68%
1 janv. 2014
77.246
-0.532
-0.68%
Classement des pays selon les statistiques actuelles par années


Commentaires: