30
/fr/
AIzaSyAYiBZKx7MnpbEhh9jyipgxe19OcubqV5w
April 1, 2024
128103
Eritrea
ERI
true
2
1
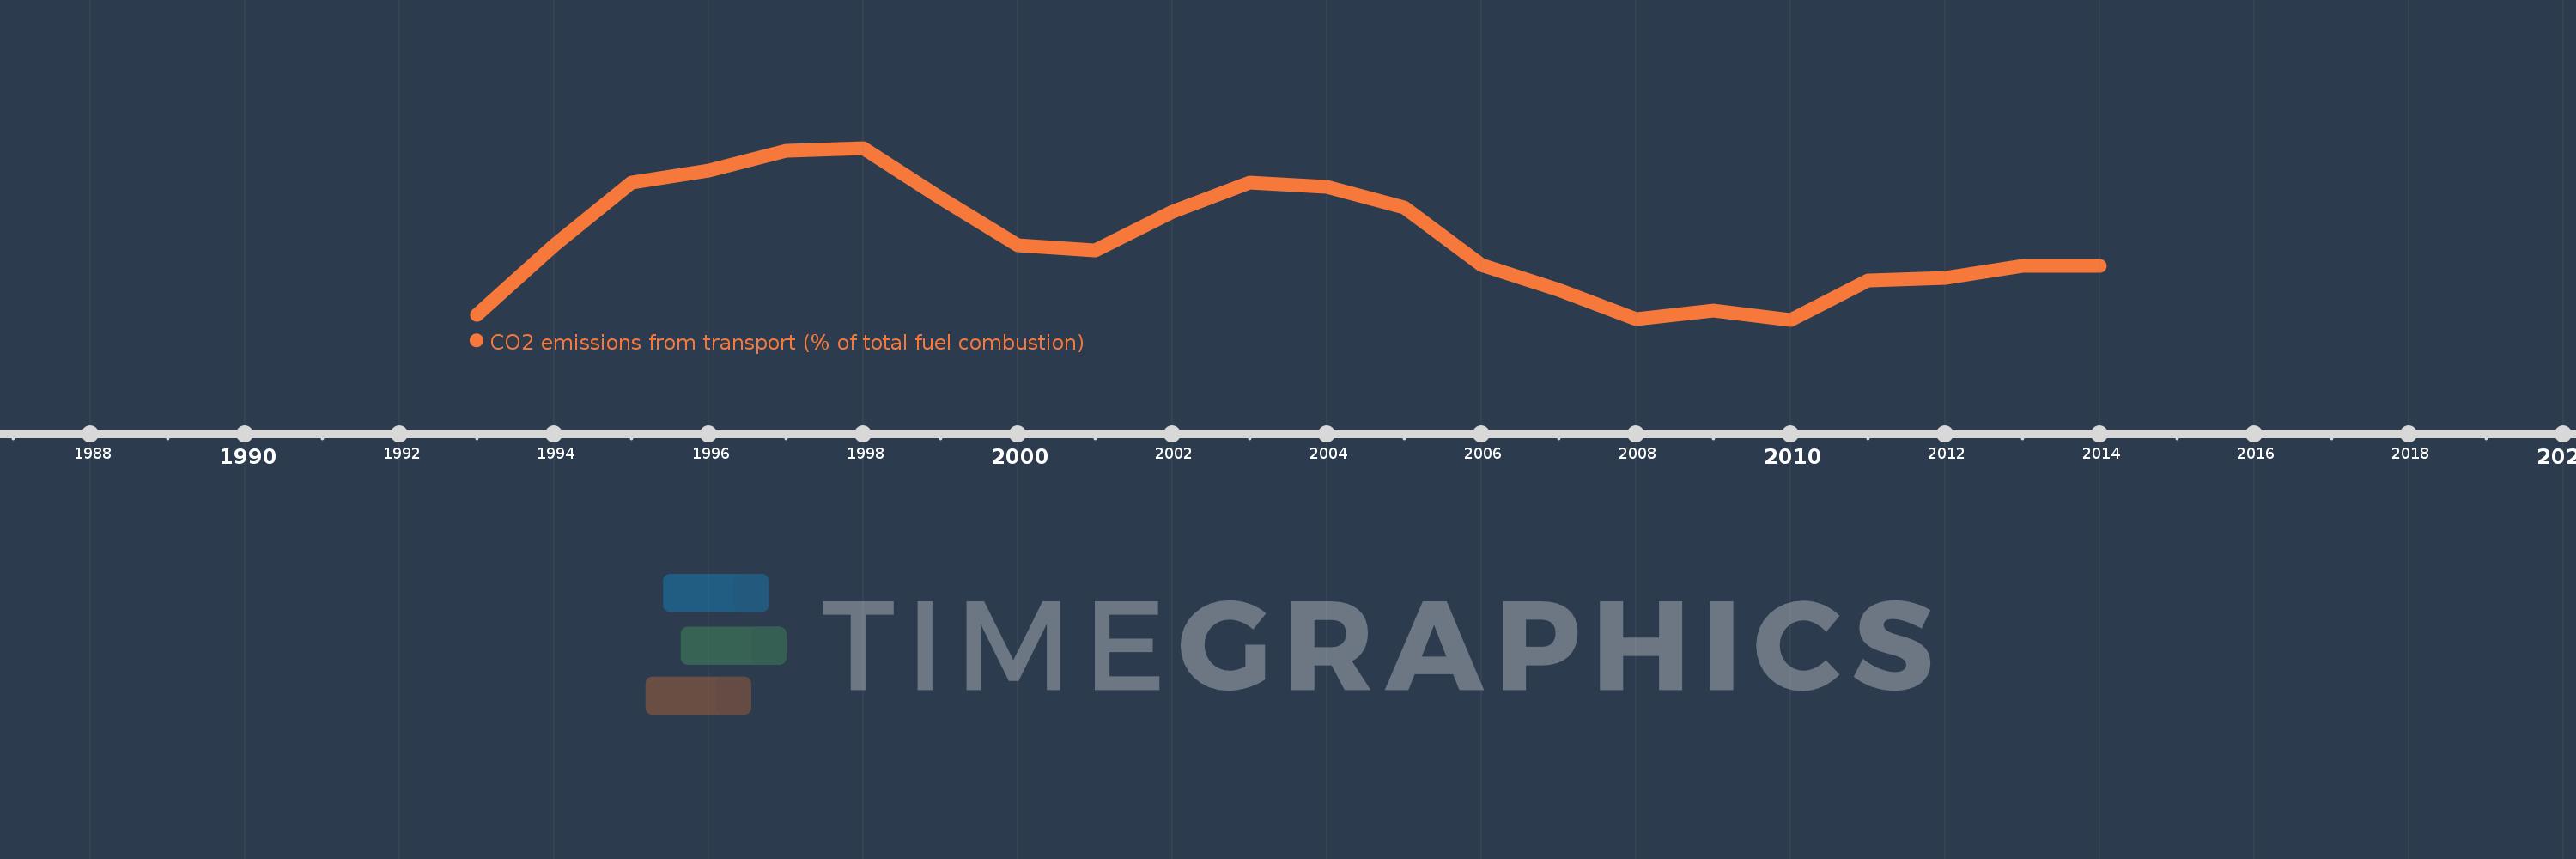
CO2 emissions from transport (% of total fuel combustion)
2014,2013,2012,2011,2010,2009,2008,2007,2006,2005,2004,2003,2002,2001,2000,1999,1998,1997,1996,1995,1994,1993
Public Timelines
FAQ
Menu
Public Timelines
FAQ
For education
For educational institutions
For teachers
For students
Open cabinet
Créer
Close
Create a timeline
Public timelines
Library
FAQ
Download
Bibliothèque de statistiques globales
→
Eritrea
→
CO2 emissions from transport (% of total fuel combustion)
Cette statistique dans les autres pays:
Albania
Algeria
Angola
Arab World
Argentina
Armenia
Australia
Austria
Azerbaijan
Bahrain
Bangladesh
Belarus
Belgium
Benin
Bolivia
Bosnia and Herzegovina
Botswana
Brazil
Brunei Darussalam
Bulgaria
Cambodia
Cameroon
Canada
Caribbean small states
Central Europe and the Baltics
Chile
China
Colombia
Congo, Dem. Rep.
Congo, Rep.
Costa Rica
Cote d'Ivoire
Croatia
Cuba
Curacao
Cyprus
Czech Republic
Denmark
Dominican Republic
Early-demographic dividend
East Asia & Pacific
East Asia & Pacific (excluding high income)
East Asia & Pacific (IDA & IBRD countries)
Ecuador
Egypt, Arab Rep.
El Salvador
Eritrea
Estonia
Ethiopia
Euro area
Europe & Central Asia
Europe & Central Asia (excluding high income)
Europe & Central Asia (IDA & IBRD countries)
European Union
Finland
Fragile and conflict affected situations
France
Gabon
Georgia
Germany
Ghana
Gibraltar
Greece
Guatemala
Haiti
Heavily indebted poor countries (HIPC)
High income
Honduras
Hong Kong SAR, China
Hungary
IBRD only
Iceland
IDA & IBRD total
IDA blend
IDA only
IDA total
India
Indonesia
Iran, Islamic Rep.
Iraq
Ireland
Israel
Italy
Jamaica
Japan
Jordan
Kazakhstan
Kenya
Korea, Dem. People’s Rep.
Korea, Rep.
Kosovo
Kuwait
Kyrgyz Republic
Late-demographic dividend
Latin America & Caribbean
Latin America & Caribbean (excluding high income)
Latin America & the Caribbean (IDA & IBRD countries)
Latvia
Least developed countries: UN classification
Lebanon
Libya
Lithuania
Low & middle income
Low income
Lower middle income
Luxembourg
Macedonia, FYR
Malaysia
Malta
Mauritius
Mexico
Middle East & North Africa
Middle East & North Africa (excluding high income)
Middle East & North Africa (IDA & IBRD countries)
Middle income
Moldova
Mongolia
Montenegro
Morocco
Mozambique
Myanmar
Namibia
Nepal
Netherlands
New Zealand
Nicaragua
Niger
Nigeria
North America
Norway
OECD members
Oman
Other small states
Pakistan
Panama
Paraguay
Peru
Philippines
Poland
Portugal
Post-demographic dividend
Pre-demographic dividend
Qatar
Romania
Russian Federation
Saudi Arabia
Senegal
Serbia
Singapore
Slovak Republic
Slovenia
Small states
South Africa
South Asia
South Asia (IDA & IBRD)
South Sudan
Spain
Sri Lanka
Sub-Saharan Africa
Sub-Saharan Africa (excluding high income)
Sub-Saharan Africa (IDA & IBRD countries)
Sudan
Sweden
Switzerland
Syrian Arab Republic
Tajikistan
Tanzania
Thailand
Togo
Trinidad and Tobago
Tunisia
Turkey
Turkmenistan
Ukraine
United Arab Emirates
United Kingdom
United States
Upper middle income
Uruguay
Uzbekistan
Venezuela, RB
Vietnam
World
Yemen, Rep.
Zambia
Zimbabwe
La ligne de temps
Cette échelle de temps montre un graphique de
1993
année à
2014
année Eritrea. Les données jusqu'à
1992
année ne sont pas présentés. Quantité d'observations actuelles selon dates:
22
.
Source (désignation):
Les indicateurs du développement mondiale
Source (organisation):
IEA Statistics © OECD/IEA 2014 (http://www.iea.org/stats/index.asp), subject to https://www.iea.org/t&c/termsandconditions/
Catégories:
Environment
Dernière mise à jour
23 avr. 2017
Les indicateurs de changement de valeurs selon les années
En moyenne:
33.938
Minimum:
24.444
1 janv. 2010
Maximum:
45.0
1 janv. 1998
Pour la date d''observation
Valeur
Changement absolu
Le changement par rapport à la valeur précédente
1 janv. 1993
25.0
+25.0
0.0%
1 janv. 1994
33.333
+8.333
33.33%
1 janv. 1995
40.845
+7.512
22.54%
1 janv. 1996
42.308
+1.463
3.58%
1 janv. 1997
44.706
+2.398
5.67%
1 janv. 1998
45.0
+0.294
0.66%
1 janv. 1999
38.983
-6.017
-13.37%
1 janv. 2000
33.333
-5.65
-14.49%
1 janv. 2001
32.787
-0.546
-1.64%
1 janv. 2002
37.313
+4.527
13.81%
1 janv. 2003
40.909
+3.596
9.64%
1 janv. 2004
40.299
-0.611
-1.49%
1 janv. 2005
37.879
-2.42
-6.0%
1 janv. 2006
31.034
-6.844
-18.07%
1 janv. 2007
28.0
-3.034
-9.78%
1 janv. 2008
24.49
-3.51
-12.54%
1 janv. 2009
25.581
+1.092
4.46%
1 janv. 2010
24.444
-1.137
-4.44%
1 janv. 2011
29.167
+4.722
19.32%
1 janv. 2012
29.412
+0.245
0.84%
1 janv. 2013
30.909
+1.497
5.09%
1 janv. 2014
30.909
0.0
0.0%
Classement des pays selon les statistiques actuelles par années
About & Feedback
Un accord
Confidentialité
Bibliothèque
2024
©
Time.Graphics
Support 24/7
Cabinet
Get premium
Donate
The service accepts bank transfer (ACH, Wire) or cards (Visa, MasterCard, etc). Processed by Stripe.
Secured with SSL
Excellent (Trustpilot Reviews)
Based on 115+ reviews
Write your own review on
Trustpilot.com
