29
/fr/
fr
AIzaSyAYiBZKx7MnpbEhh9jyipgxe19OcubqV5w
April 1, 2024
245339
South Africa
ZAF
true
2
1
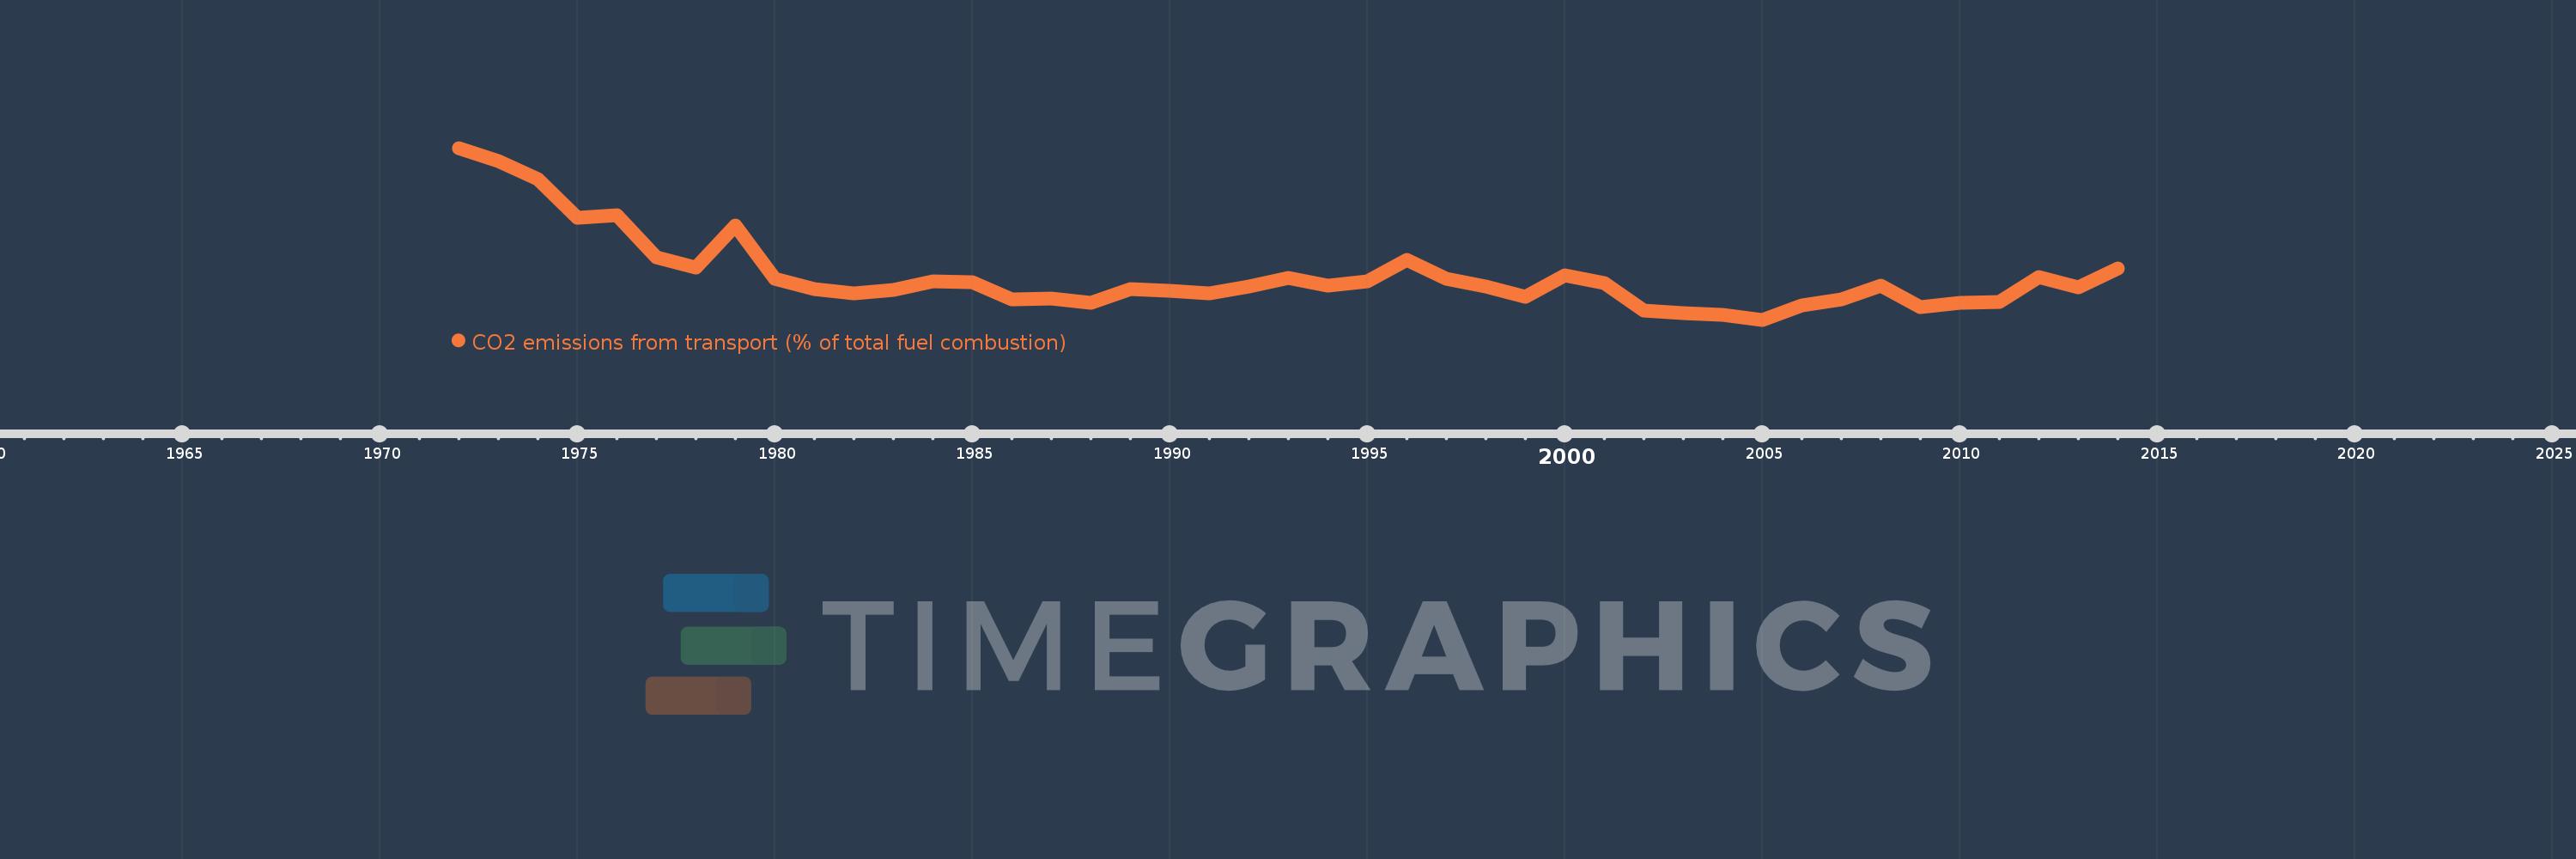
CO2 emissions from transport (% of total fuel combustion)
2014,2013,2012,2011,2010,2009,2008,2007,2006,2005,2004,2003,2002,2001,2000,1999,1998,1997,1996,1995,1994,1993,1992,1991,1990,1989,1988,1987,1986,1985,1984,1983,1982,1981,1980,1979,1978,1977,1976,1975,1974,1973,1972
Cette statistique dans les autres pays:
AlbaniaAlgeriaAngolaArab WorldArgentinaArmeniaAustraliaAustriaAzerbaijanBahrainBangladeshBelarusBelgiumBeninBoliviaBosnia and HerzegovinaBotswanaBrazilBrunei DarussalamBulgariaCambodiaCameroonCanadaCaribbean small statesCentral Europe and the BalticsChileChinaColombiaCongo, Dem. Rep.Congo, Rep.Costa RicaCote d'IvoireCroatiaCubaCuracaoCyprusCzech RepublicDenmarkDominican RepublicEarly-demographic dividendEast Asia & PacificEast Asia & Pacific (excluding high income)East Asia & Pacific (IDA & IBRD countries)EcuadorEgypt, Arab Rep.El SalvadorEritreaEstoniaEthiopiaEuro areaEurope & Central AsiaEurope & Central Asia (excluding high income)Europe & Central Asia (IDA & IBRD countries)European UnionFinlandFragile and conflict affected situationsFranceGabonGeorgiaGermanyGhanaGibraltarGreeceGuatemalaHaitiHeavily indebted poor countries (HIPC)High incomeHondurasHong Kong SAR, ChinaHungaryIBRD onlyIcelandIDA & IBRD totalIDA blendIDA onlyIDA totalIndiaIndonesiaIran, Islamic Rep.IraqIrelandIsraelItalyJamaicaJapanJordanKazakhstanKenyaKorea, Dem. People’s Rep.Korea, Rep.KosovoKuwaitKyrgyz RepublicLate-demographic dividendLatin America & Caribbean Latin America & Caribbean (excluding high income)Latin America & the Caribbean (IDA & IBRD countries)LatviaLeast developed countries: UN classificationLebanonLibyaLithuaniaLow & middle incomeLow incomeLower middle incomeLuxembourgMacedonia, FYRMalaysiaMaltaMauritiusMexicoMiddle East & North AfricaMiddle East & North Africa (excluding high income)Middle East & North Africa (IDA & IBRD countries)Middle incomeMoldovaMongoliaMontenegroMoroccoMozambiqueMyanmarNamibiaNepalNetherlandsNew ZealandNicaraguaNigerNigeriaNorth AmericaNorwayOECD membersOmanOther small statesPakistanPanamaParaguayPeruPhilippinesPolandPortugalPost-demographic dividendPre-demographic dividendQatarRomaniaRussian FederationSaudi ArabiaSenegalSerbiaSingaporeSlovak RepublicSloveniaSmall statesSouth AfricaSouth AsiaSouth Asia (IDA & IBRD)South SudanSpainSri LankaSub-Saharan Africa Sub-Saharan Africa (excluding high income)Sub-Saharan Africa (IDA & IBRD countries)SudanSwedenSwitzerlandSyrian Arab RepublicTajikistanTanzaniaThailandTogoTrinidad and TobagoTunisiaTurkeyTurkmenistanUkraineUnited Arab EmiratesUnited KingdomUnited StatesUpper middle incomeUruguayUzbekistanVenezuela, RBVietnamWorldYemen, Rep.ZambiaZimbabwe La ligne de temps
Cette échelle de temps montre un graphique de 1972 année à 2014 année South Africa. Les données jusqu'à 1971 année ne sont pas présentés. Quantité d'observations actuelles selon dates: 43.
Source (désignation):
Les indicateurs du développement mondiale
Source (organisation):
IEA Statistics © OECD/IEA 2014 (http://www.iea.org/stats/index.asp), subject to https://www.iea.org/t&c/termsandconditions/
Catégories:
Environment
Dernière mise à jour
23 avr. 2017
Les indicateurs de changement de valeurs selon les années
Minimum:
10.987
1 janv. 2005
Maximum:
18.283
1 janv. 1972
Pour la date d''observation
Valeur
Changement absolu
Le changement par rapport à la valeur précédente
1 janv. 1972
18.283
+18.283
0.0%
1 janv. 1973
17.72
-0.563
-3.08%
1 janv. 1974
16.964
-0.756
-4.27%
1 janv. 1975
15.31
-1.653
-9.75%
1 janv. 1976
15.441
+0.13
0.85%
1 janv. 1977
13.629
-1.812
-11.73%
1 janv. 1978
13.201
-0.428
-3.14%
1 janv. 1979
15.003
+1.802
13.65%
1 janv. 1980
12.74
-2.262
-15.08%
1 janv. 1981
12.276
-0.465
-3.65%
1 janv. 1982
12.1
-0.176
-1.43%
1 janv. 1983
12.244
+0.144
1.19%
1 janv. 1984
12.602
+0.359
2.93%
1 janv. 1985
12.571
-0.031
-0.24%
1 janv. 1986
11.851
-0.72
-5.73%
1 janv. 1987
11.875
+0.024
0.2%
1 janv. 1988
11.708
-0.167
-1.41%
1 janv. 1989
12.29
+0.582
4.97%
1 janv. 1990
12.224
-0.066
-0.54%
1 janv. 1991
12.115
-0.108
-0.89%
1 janv. 1992
12.389
+0.273
2.26%
1 janv. 1993
12.771
+0.382
3.08%
1 janv. 1994
12.445
-0.325
-2.55%
1 janv. 1995
12.626
+0.181
1.45%
1 janv. 1996
13.54
+0.914
7.24%
1 janv. 1997
12.727
-0.813
-6.0%
1 janv. 1998
12.401
-0.327
-2.57%
1 janv. 1999
11.95
-0.451
-3.63%
1 janv. 2000
12.889
+0.939
7.86%
1 janv. 2001
12.541
-0.348
-2.7%
1 janv. 2002
11.375
-1.166
-9.3%
1 janv. 2003
11.257
-0.119
-1.04%
1 janv. 2004
11.19
-0.067
-0.59%
1 janv. 2005
10.987
-0.203
-1.81%
1 janv. 2006
11.601
+0.614
5.59%
1 janv. 2007
11.857
+0.256
2.2%
1 janv. 2008
12.451
+0.595
5.01%
1 janv. 2009
11.521
-0.93
-7.47%
1 janv. 2010
11.707
+0.186
1.61%
1 janv. 2011
11.759
+0.052
0.44%
1 janv. 2012
12.791
+1.032
8.78%
1 janv. 2013
12.379
-0.412
-3.22%
1 janv. 2014
13.152
+0.773
6.24%
Classement des pays selon les statistiques actuelles par années


Commentaires: