29
/fr/
fr
AIzaSyAYiBZKx7MnpbEhh9jyipgxe19OcubqV5w
April 1, 2024
105767
China
CHN
true
2
1
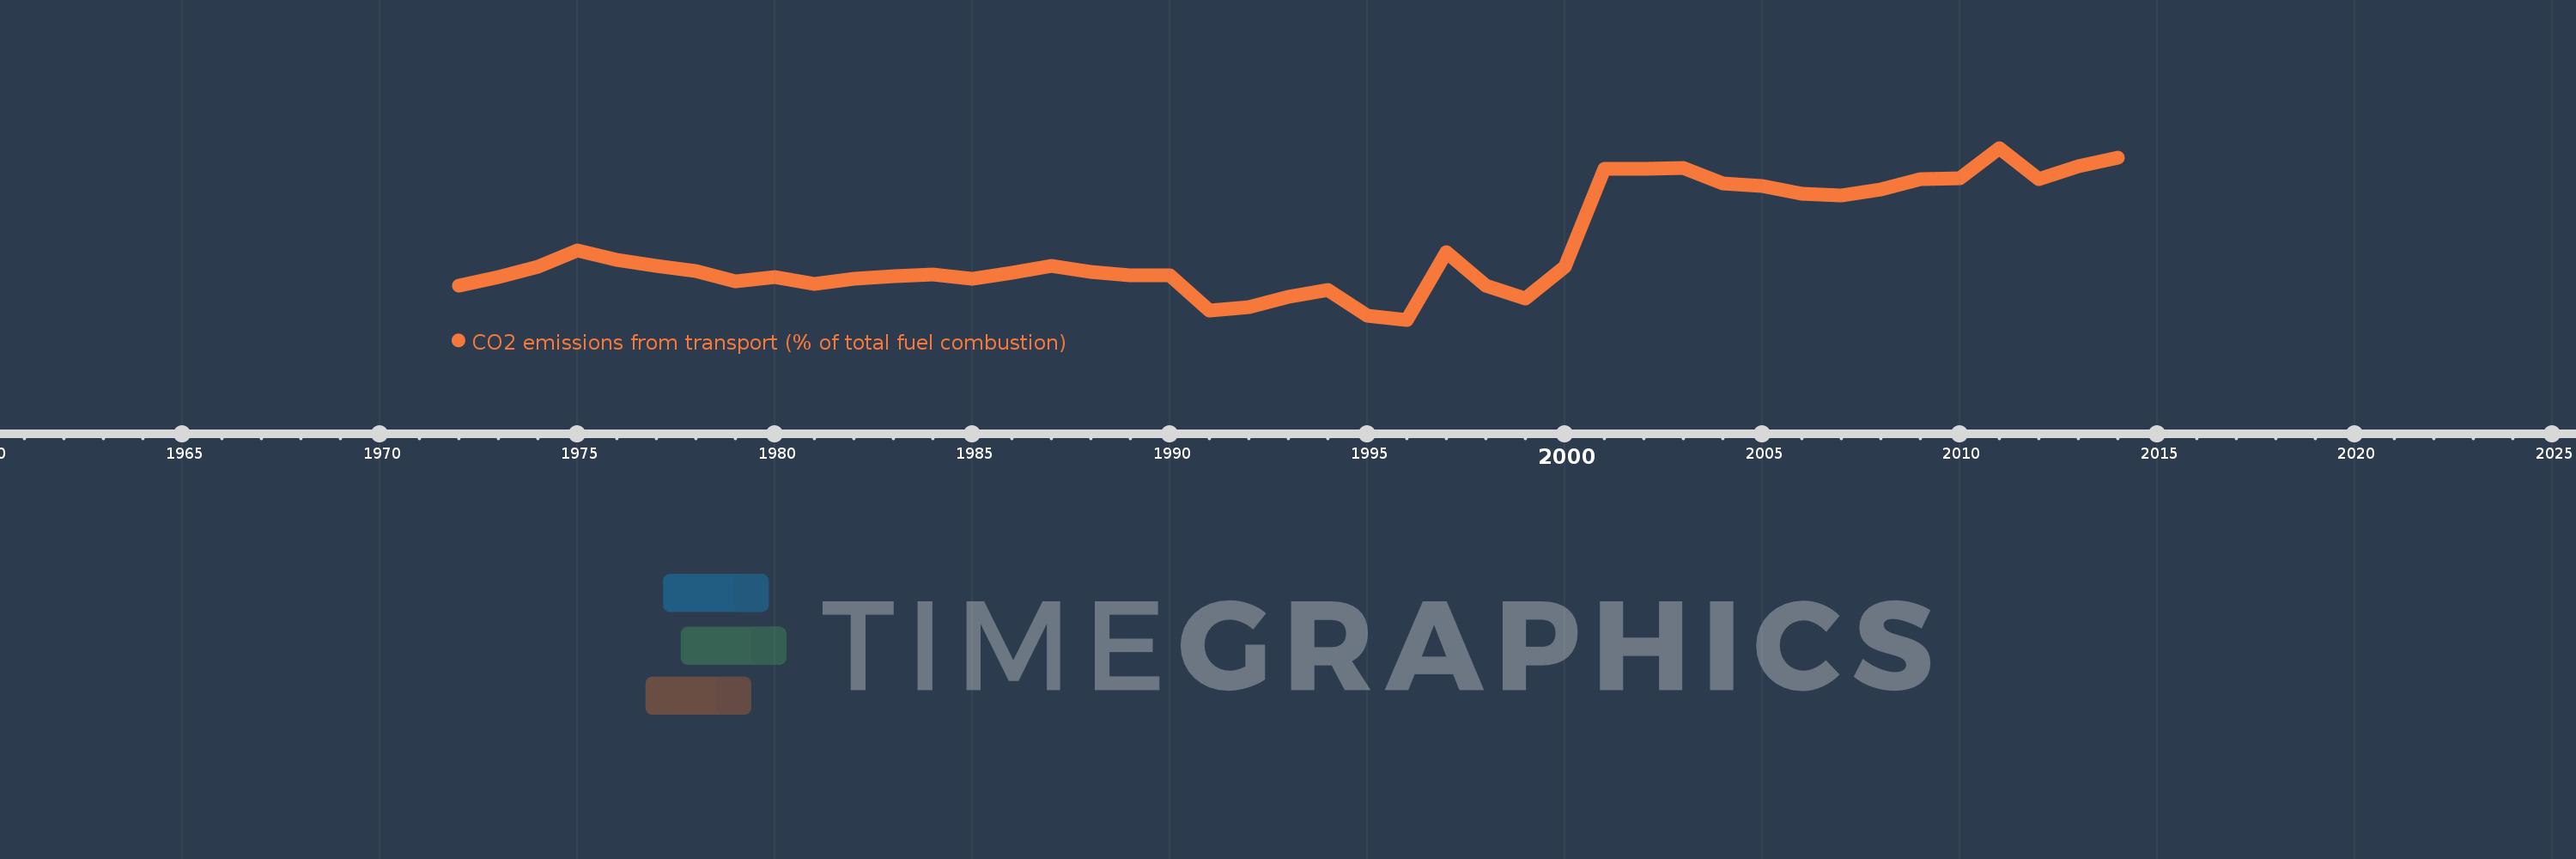
CO2 emissions from transport (% of total fuel combustion)
2014,2013,2012,2011,2010,2009,2008,2007,2006,2005,2004,2003,2002,2001,2000,1999,1998,1997,1996,1995,1994,1993,1992,1991,1990,1989,1988,1987,1986,1985,1984,1983,1982,1981,1980,1979,1978,1977,1976,1975,1974,1973,1972
Cette statistique dans les autres pays:
AlbaniaAlgeriaAngolaArab WorldArgentinaArmeniaAustraliaAustriaAzerbaijanBahrainBangladeshBelarusBelgiumBeninBoliviaBosnia and HerzegovinaBotswanaBrazilBrunei DarussalamBulgariaCambodiaCameroonCanadaCaribbean small statesCentral Europe and the BalticsChileChinaColombiaCongo, Dem. Rep.Congo, Rep.Costa RicaCote d'IvoireCroatiaCubaCuracaoCyprusCzech RepublicDenmarkDominican RepublicEarly-demographic dividendEast Asia & PacificEast Asia & Pacific (excluding high income)East Asia & Pacific (IDA & IBRD countries)EcuadorEgypt, Arab Rep.El SalvadorEritreaEstoniaEthiopiaEuro areaEurope & Central AsiaEurope & Central Asia (excluding high income)Europe & Central Asia (IDA & IBRD countries)European UnionFinlandFragile and conflict affected situationsFranceGabonGeorgiaGermanyGhanaGibraltarGreeceGuatemalaHaitiHeavily indebted poor countries (HIPC)High incomeHondurasHong Kong SAR, ChinaHungaryIBRD onlyIcelandIDA & IBRD totalIDA blendIDA onlyIDA totalIndiaIndonesiaIran, Islamic Rep.IraqIrelandIsraelItalyJamaicaJapanJordanKazakhstanKenyaKorea, Dem. People’s Rep.Korea, Rep.KosovoKuwaitKyrgyz RepublicLate-demographic dividendLatin America & Caribbean Latin America & Caribbean (excluding high income)Latin America & the Caribbean (IDA & IBRD countries)LatviaLeast developed countries: UN classificationLebanonLibyaLithuaniaLow & middle incomeLow incomeLower middle incomeLuxembourgMacedonia, FYRMalaysiaMaltaMauritiusMexicoMiddle East & North AfricaMiddle East & North Africa (excluding high income)Middle East & North Africa (IDA & IBRD countries)Middle incomeMoldovaMongoliaMontenegroMoroccoMozambiqueMyanmarNamibiaNepalNetherlandsNew ZealandNicaraguaNigerNigeriaNorth AmericaNorwayOECD membersOmanOther small statesPakistanPanamaParaguayPeruPhilippinesPolandPortugalPost-demographic dividendPre-demographic dividendQatarRomaniaRussian FederationSaudi ArabiaSenegalSerbiaSingaporeSlovak RepublicSloveniaSmall statesSouth AfricaSouth AsiaSouth Asia (IDA & IBRD)South SudanSpainSri LankaSub-Saharan Africa Sub-Saharan Africa (excluding high income)Sub-Saharan Africa (IDA & IBRD countries)SudanSwedenSwitzerlandSyrian Arab RepublicTajikistanTanzaniaThailandTogoTrinidad and TobagoTunisiaTurkeyTurkmenistanUkraineUnited Arab EmiratesUnited KingdomUnited StatesUpper middle incomeUruguayUzbekistanVenezuela, RBVietnamWorldYemen, Rep.ZambiaZimbabwe La ligne de temps
Cette échelle de temps montre un graphique de 1972 année à 2014 année China. Les données jusqu'à 1971 année ne sont pas présentés. Quantité d'observations actuelles selon dates: 43.
Source (désignation):
Les indicateurs du développement mondiale
Source (organisation):
IEA Statistics © OECD/IEA 2014 (http://www.iea.org/stats/index.asp), subject to https://www.iea.org/t&c/termsandconditions/
Catégories:
Environment
Dernière mise à jour
23 avr. 2017
Les indicateurs de changement de valeurs selon les années
Minimum:
4.696
1 janv. 1996
Maximum:
8.625
1 janv. 2011
Pour la date d''observation
Valeur
Changement absolu
Le changement par rapport à la valeur précédente
1 janv. 1972
5.469
+5.469
0.0%
1 janv. 1973
5.664
+0.195
3.57%
1 janv. 1974
5.915
+0.251
4.44%
1 janv. 1975
6.277
+0.362
6.11%
1 janv. 1976
6.06
-0.216
-3.45%
1 janv. 1977
5.921
-0.139
-2.3%
1 janv. 1978
5.809
-0.112
-1.9%
1 janv. 1979
5.566
-0.242
-4.17%
1 janv. 1980
5.675
+0.109
1.95%
1 janv. 1981
5.506
-0.169
-2.98%
1 janv. 1982
5.624
+0.118
2.15%
1 janv. 1983
5.685
+0.061
1.08%
1 janv. 1984
5.735
+0.05
0.88%
1 janv. 1985
5.625
-0.11
-1.91%
1 janv. 1986
5.766
+0.141
2.5%
1 janv. 1987
5.93
+0.164
2.84%
1 janv. 1988
5.789
-0.14
-2.36%
1 janv. 1989
5.704
-0.085
-1.48%
1 janv. 1990
5.72
+0.016
0.29%
1 janv. 1991
4.902
-0.819
-14.31%
1 janv. 1992
4.976
+0.074
1.51%
1 janv. 1993
5.221
+0.245
4.93%
1 janv. 1994
5.38
+0.159
3.05%
1 janv. 1995
4.787
-0.594
-11.03%
1 janv. 1996
4.696
-0.091
-1.89%
1 janv. 1997
6.239
+1.543
32.85%
1 janv. 1998
5.47
-0.769
-12.33%
1 janv. 1999
5.183
-0.286
-5.24%
1 janv. 2000
5.904
+0.72
13.9%
1 janv. 2001
8.143
+2.239
37.93%
1 janv. 2002
8.146
+0.003
0.03%
1 janv. 2003
8.172
+0.026
0.32%
1 janv. 2004
7.808
-0.364
-4.46%
1 janv. 2005
7.762
-0.046
-0.59%
1 janv. 2006
7.578
-0.184
-2.38%
1 janv. 2007
7.547
-0.031
-0.41%
1 janv. 2008
7.685
+0.139
1.84%
1 janv. 2009
7.916
+0.231
3.01%
1 janv. 2010
7.932
+0.016
0.2%
1 janv. 2011
8.625
+0.693
8.74%
1 janv. 2012
7.911
-0.714
-8.28%
1 janv. 2013
8.203
+0.292
3.69%
1 janv. 2014
8.396
+0.193
2.35%
Classement des pays selon les statistiques actuelles par années


Commentaires: