29
/fr/
fr
AIzaSyAYiBZKx7MnpbEhh9jyipgxe19OcubqV5w
April 1, 2024
260637
Tanzania
TZA
true
2
1
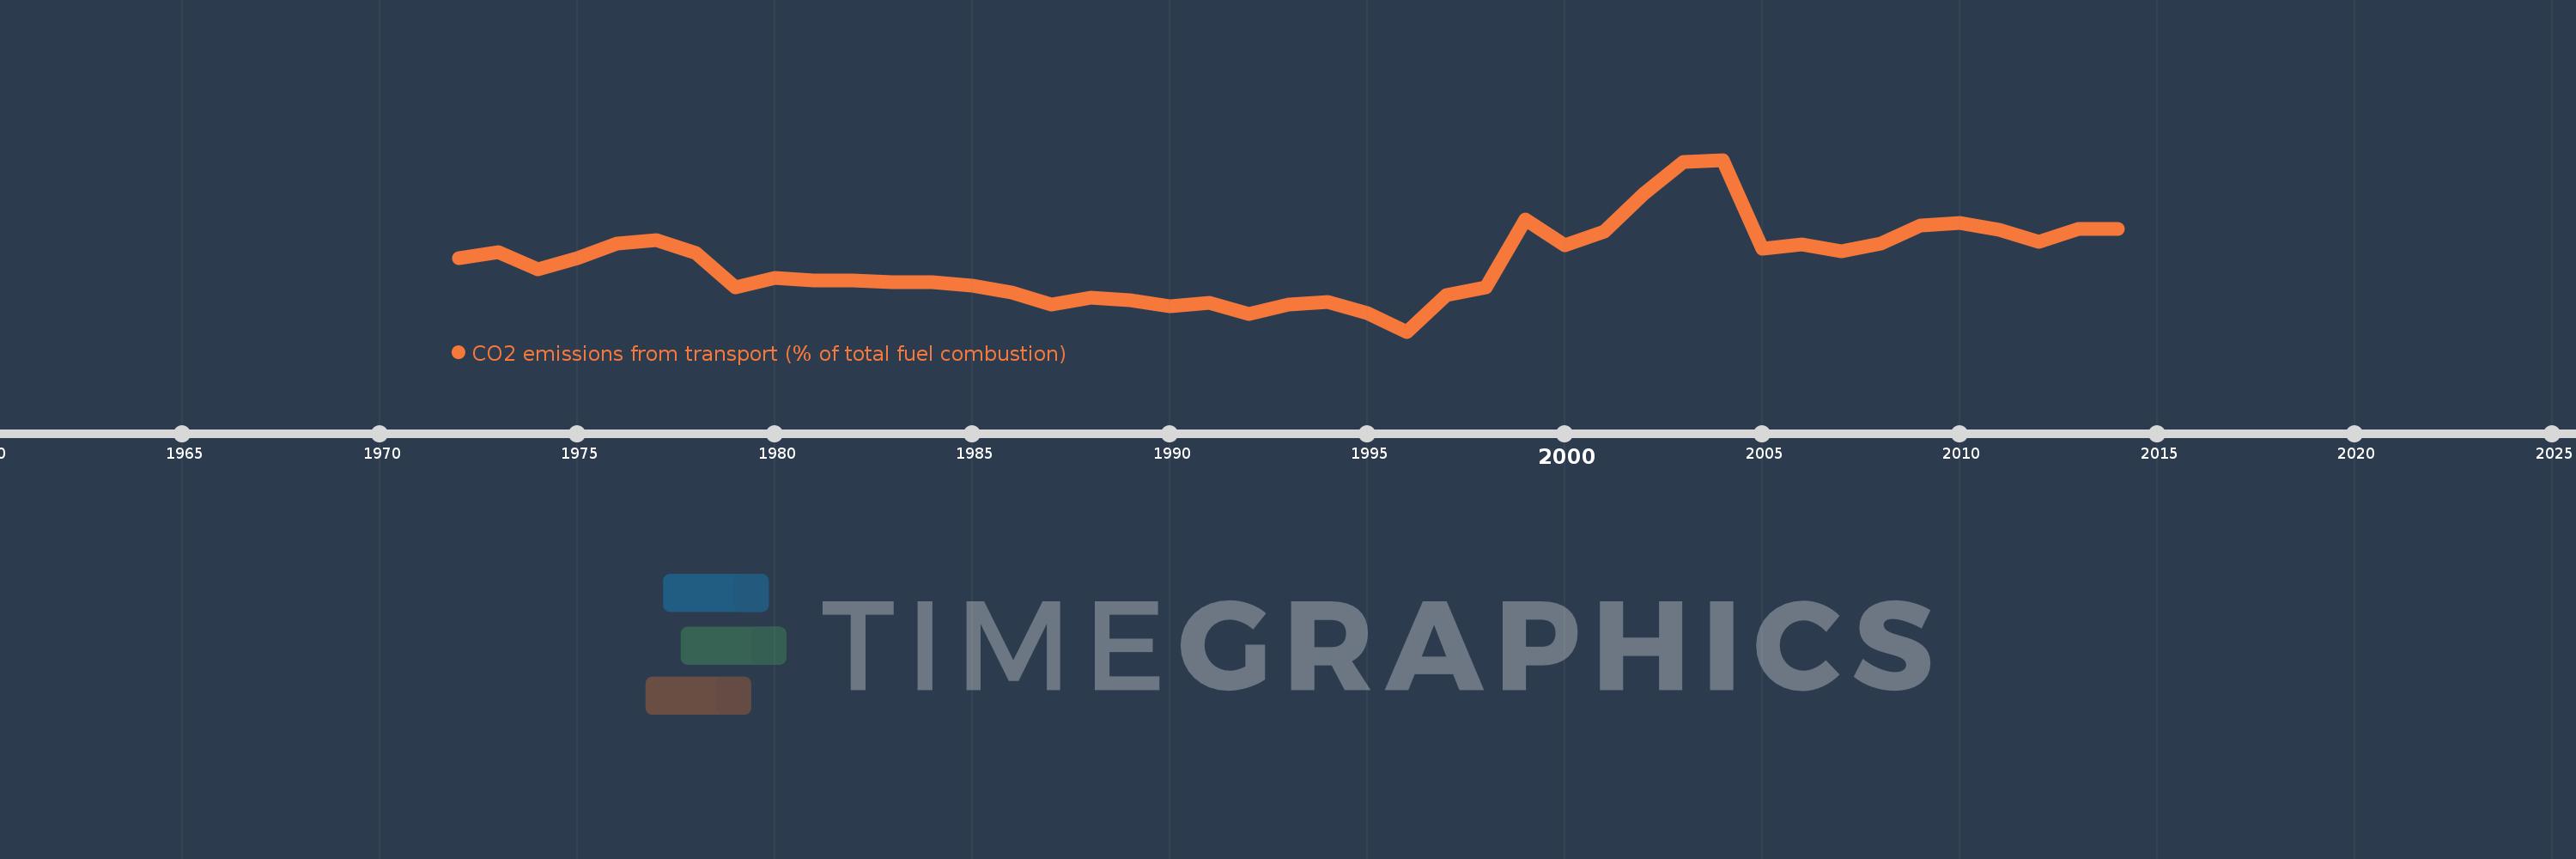
CO2 emissions from transport (% of total fuel combustion)
2014,2013,2012,2011,2010,2009,2008,2007,2006,2005,2004,2003,2002,2001,2000,1999,1998,1997,1996,1995,1994,1993,1992,1991,1990,1989,1988,1987,1986,1985,1984,1983,1982,1981,1980,1979,1978,1977,1976,1975,1974,1973,1972
Cette statistique dans les autres pays:
AlbaniaAlgeriaAngolaArab WorldArgentinaArmeniaAustraliaAustriaAzerbaijanBahrainBangladeshBelarusBelgiumBeninBoliviaBosnia and HerzegovinaBotswanaBrazilBrunei DarussalamBulgariaCambodiaCameroonCanadaCaribbean small statesCentral Europe and the BalticsChileChinaColombiaCongo, Dem. Rep.Congo, Rep.Costa RicaCote d'IvoireCroatiaCubaCuracaoCyprusCzech RepublicDenmarkDominican RepublicEarly-demographic dividendEast Asia & PacificEast Asia & Pacific (excluding high income)East Asia & Pacific (IDA & IBRD countries)EcuadorEgypt, Arab Rep.El SalvadorEritreaEstoniaEthiopiaEuro areaEurope & Central AsiaEurope & Central Asia (excluding high income)Europe & Central Asia (IDA & IBRD countries)European UnionFinlandFragile and conflict affected situationsFranceGabonGeorgiaGermanyGhanaGibraltarGreeceGuatemalaHaitiHeavily indebted poor countries (HIPC)High incomeHondurasHong Kong SAR, ChinaHungaryIBRD onlyIcelandIDA & IBRD totalIDA blendIDA onlyIDA totalIndiaIndonesiaIran, Islamic Rep.IraqIrelandIsraelItalyJamaicaJapanJordanKazakhstanKenyaKorea, Dem. People’s Rep.Korea, Rep.KosovoKuwaitKyrgyz RepublicLate-demographic dividendLatin America & Caribbean Latin America & Caribbean (excluding high income)Latin America & the Caribbean (IDA & IBRD countries)LatviaLeast developed countries: UN classificationLebanonLibyaLithuaniaLow & middle incomeLow incomeLower middle incomeLuxembourgMacedonia, FYRMalaysiaMaltaMauritiusMexicoMiddle East & North AfricaMiddle East & North Africa (excluding high income)Middle East & North Africa (IDA & IBRD countries)Middle incomeMoldovaMongoliaMontenegroMoroccoMozambiqueMyanmarNamibiaNepalNetherlandsNew ZealandNicaraguaNigerNigeriaNorth AmericaNorwayOECD membersOmanOther small statesPakistanPanamaParaguayPeruPhilippinesPolandPortugalPost-demographic dividendPre-demographic dividendQatarRomaniaRussian FederationSaudi ArabiaSenegalSerbiaSingaporeSlovak RepublicSloveniaSmall statesSouth AfricaSouth AsiaSouth Asia (IDA & IBRD)South SudanSpainSri LankaSub-Saharan Africa Sub-Saharan Africa (excluding high income)Sub-Saharan Africa (IDA & IBRD countries)SudanSwedenSwitzerlandSyrian Arab RepublicTajikistanTanzaniaThailandTogoTrinidad and TobagoTunisiaTurkeyTurkmenistanUkraineUnited Arab EmiratesUnited KingdomUnited StatesUpper middle incomeUruguayUzbekistanVenezuela, RBVietnamWorldYemen, Rep.ZambiaZimbabwe La ligne de temps
Cette échelle de temps montre un graphique de 1972 année à 2014 année Tanzania. Les données jusqu'à 1971 année ne sont pas présentés. Quantité d'observations actuelles selon dates: 43.
Source (désignation):
Les indicateurs du développement mondiale
Source (organisation):
IEA Statistics © OECD/IEA 2014 (http://www.iea.org/stats/index.asp), subject to https://www.iea.org/t&c/termsandconditions/
Catégories:
Environment
Dernière mise à jour
23 avr. 2017
Les indicateurs de changement de valeurs selon les années
Minimum:
36.145
1 janv. 1996
Maximum:
70.213
1 janv. 2004
Pour la date d''observation
Valeur
Changement absolu
Le changement par rapport à la valeur précédente
1 janv. 1972
50.714
+50.714
0.0%
1 janv. 1973
51.829
+1.115
2.2%
1 janv. 1974
48.503
-3.326
-6.42%
1 janv. 1975
50.667
+2.164
4.46%
1 janv. 1976
53.571
+2.905
5.73%
1 janv. 1977
54.348
+0.776
1.45%
1 janv. 1978
51.799
-2.549
-4.69%
1 janv. 1979
44.966
-6.832
-13.19%
1 janv. 1980
46.711
+1.744
3.88%
1 janv. 1981
46.309
-0.402
-0.86%
1 janv. 1982
46.259
-0.05
-0.11%
1 janv. 1983
45.926
-0.333
-0.72%
1 janv. 1984
45.985
+0.059
0.13%
1 janv. 1985
45.324
-0.662
-1.44%
1 janv. 1986
43.836
-1.488
-3.28%
1 janv. 1987
41.558
-2.277
-5.19%
1 janv. 1988
42.857
+1.299
3.13%
1 janv. 1989
42.405
-0.452
-1.05%
1 janv. 1990
41.25
-1.155
-2.72%
1 janv. 1991
41.916
+0.666
1.61%
1 janv. 1992
39.634
-2.282
-5.44%
1 janv. 1993
41.463
+1.829
4.62%
1 janv. 1994
42.012
+0.548
1.32%
1 janv. 1995
39.888
-2.124
-5.06%
1 janv. 1996
36.145
-3.743
-9.38%
1 janv. 1997
43.321
+7.177
19.86%
1 janv. 1998
44.867
+1.546
3.57%
1 janv. 1999
58.403
+13.536
30.17%
1 janv. 2000
53.211
-5.192
-8.89%
1 janv. 2001
55.939
+2.728
5.13%
1 janv. 2002
63.406
+7.467
13.35%
1 janv. 2003
69.841
+6.435
10.15%
1 janv. 2004
70.213
+0.371
0.53%
1 janv. 2005
52.516
-17.696
-25.2%
1 janv. 2006
53.465
+0.949
1.81%
1 janv. 2007
52.11
-1.355
-2.53%
1 janv. 2008
53.537
+1.427
2.74%
1 janv. 2009
57.196
+3.658
6.83%
1 janv. 2010
57.647
+0.451
0.79%
1 janv. 2011
56.281
-1.366
-2.37%
1 janv. 2012
53.966
-2.315
-4.11%
1 janv. 2013
56.553
+2.587
4.79%
1 janv. 2014
56.495
-0.058
-0.1%
Classement des pays selon les statistiques actuelles par années


Commentaires: