29
/fr/
fr
AIzaSyAYiBZKx7MnpbEhh9jyipgxe19OcubqV5w
April 1, 2024
224645
Poland
POL
true
2
1
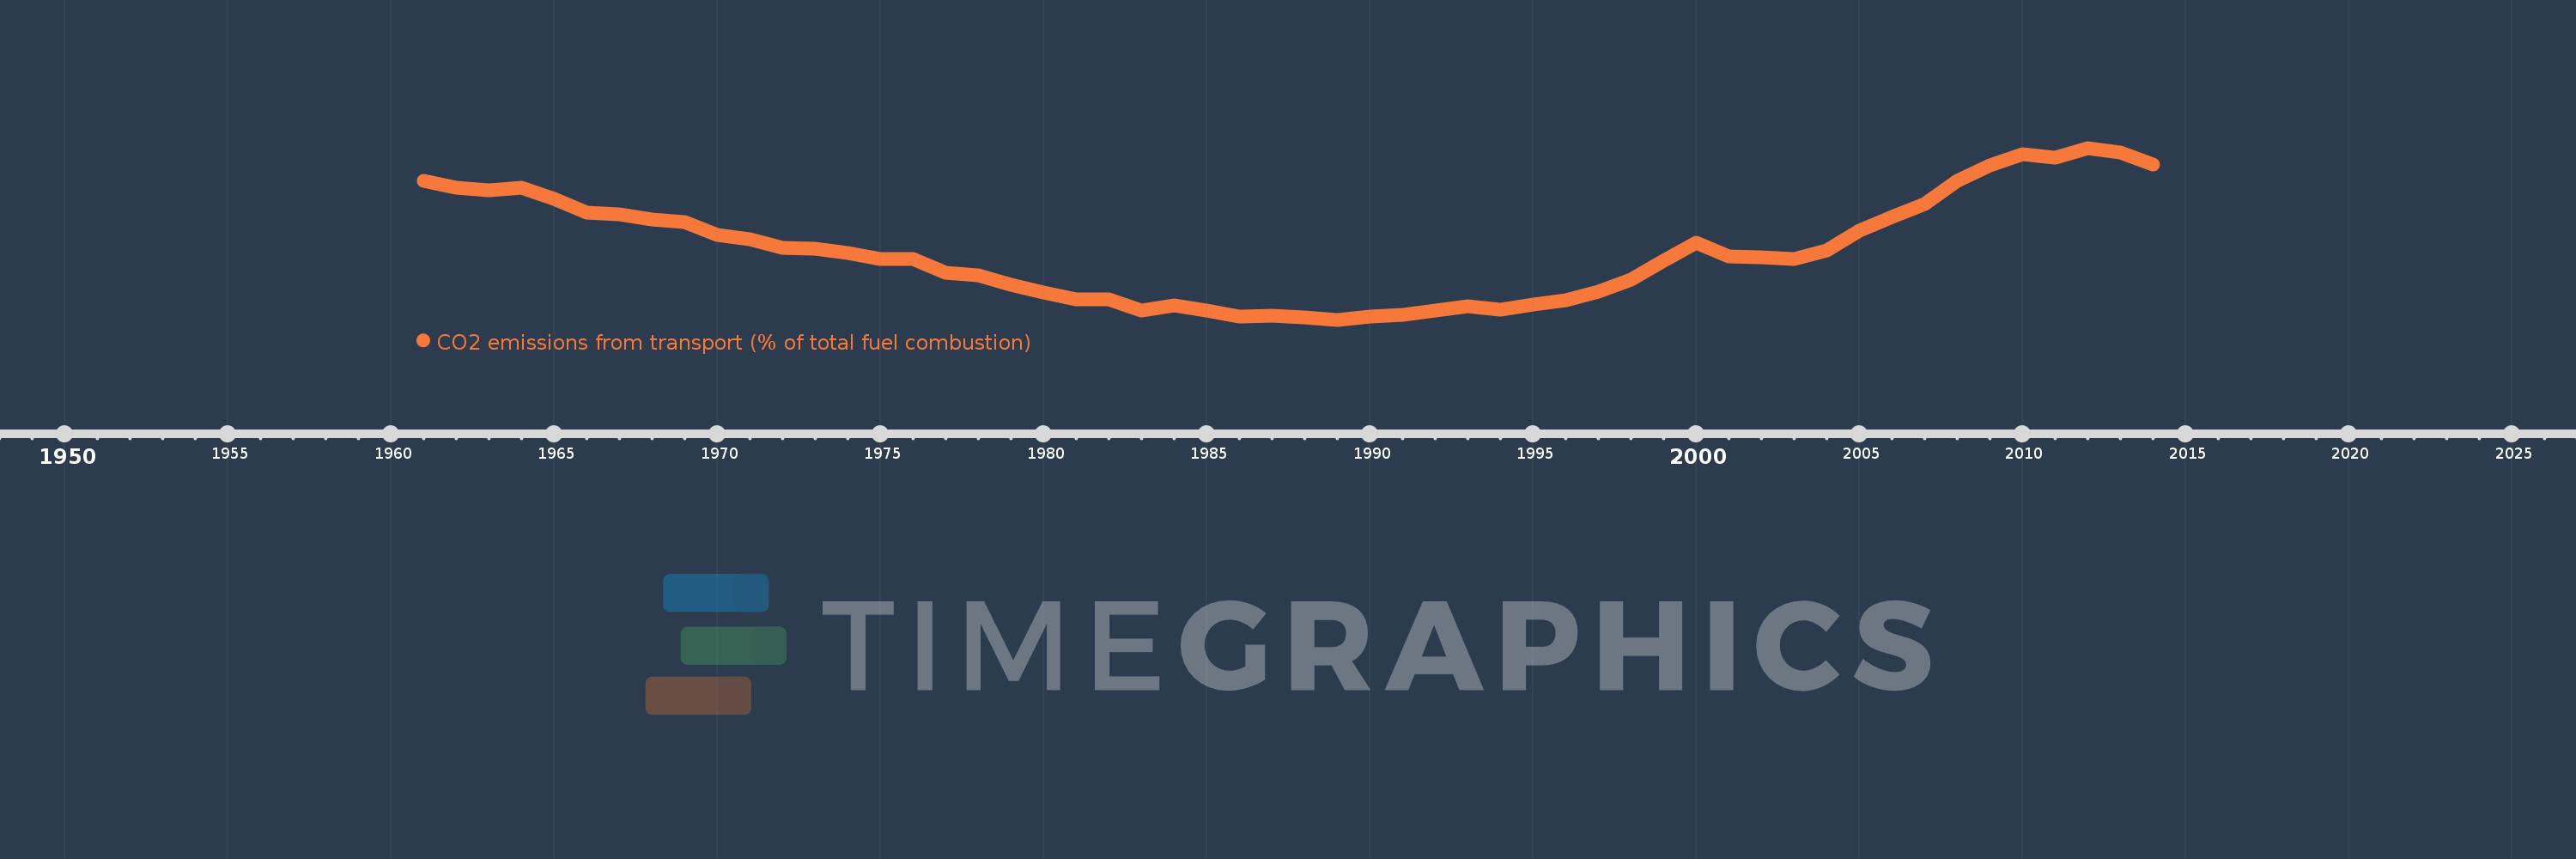
CO2 emissions from transport (% of total fuel combustion)
2014,2013,2012,2011,2010,2009,2008,2007,2006,2005,2004,2003,2002,2001,2000,1999,1998,1997,1996,1995,1994,1993,1992,1991,1990,1989,1988,1987,1986,1985,1984,1983,1982,1981,1980,1979,1978,1977,1976,1975,1974,1973,1972,1971,1970,1969,1968,1967,1966,1965,1964,1963,1962,1961
Cette statistique dans les autres pays:
AlbaniaAlgeriaAngolaArab WorldArgentinaArmeniaAustraliaAustriaAzerbaijanBahrainBangladeshBelarusBelgiumBeninBoliviaBosnia and HerzegovinaBotswanaBrazilBrunei DarussalamBulgariaCambodiaCameroonCanadaCaribbean small statesCentral Europe and the BalticsChileChinaColombiaCongo, Dem. Rep.Congo, Rep.Costa RicaCote d'IvoireCroatiaCubaCuracaoCyprusCzech RepublicDenmarkDominican RepublicEarly-demographic dividendEast Asia & PacificEast Asia & Pacific (excluding high income)East Asia & Pacific (IDA & IBRD countries)EcuadorEgypt, Arab Rep.El SalvadorEritreaEstoniaEthiopiaEuro areaEurope & Central AsiaEurope & Central Asia (excluding high income)Europe & Central Asia (IDA & IBRD countries)European UnionFinlandFragile and conflict affected situationsFranceGabonGeorgiaGermanyGhanaGibraltarGreeceGuatemalaHaitiHeavily indebted poor countries (HIPC)High incomeHondurasHong Kong SAR, ChinaHungaryIBRD onlyIcelandIDA & IBRD totalIDA blendIDA onlyIDA totalIndiaIndonesiaIran, Islamic Rep.IraqIrelandIsraelItalyJamaicaJapanJordanKazakhstanKenyaKorea, Dem. People’s Rep.Korea, Rep.KosovoKuwaitKyrgyz RepublicLate-demographic dividendLatin America & Caribbean Latin America & Caribbean (excluding high income)Latin America & the Caribbean (IDA & IBRD countries)LatviaLeast developed countries: UN classificationLebanonLibyaLithuaniaLow & middle incomeLow incomeLower middle incomeLuxembourgMacedonia, FYRMalaysiaMaltaMauritiusMexicoMiddle East & North AfricaMiddle East & North Africa (excluding high income)Middle East & North Africa (IDA & IBRD countries)Middle incomeMoldovaMongoliaMontenegroMoroccoMozambiqueMyanmarNamibiaNepalNetherlandsNew ZealandNicaraguaNigerNigeriaNorth AmericaNorwayOECD membersOmanOther small statesPakistanPanamaParaguayPeruPhilippinesPolandPortugalPost-demographic dividendPre-demographic dividendQatarRomaniaRussian FederationSaudi ArabiaSenegalSerbiaSingaporeSlovak RepublicSloveniaSmall statesSouth AfricaSouth AsiaSouth Asia (IDA & IBRD)South SudanSpainSri LankaSub-Saharan Africa Sub-Saharan Africa (excluding high income)Sub-Saharan Africa (IDA & IBRD countries)SudanSwedenSwitzerlandSyrian Arab RepublicTajikistanTanzaniaThailandTogoTrinidad and TobagoTunisiaTurkeyTurkmenistanUkraineUnited Arab EmiratesUnited KingdomUnited StatesUpper middle incomeUruguayUzbekistanVenezuela, RBVietnamWorldYemen, Rep.ZambiaZimbabwe La ligne de temps
Cette échelle de temps montre un graphique de 1961 année à 2014 année Poland. Les données jusqu'à 1960 année ne sont pas présentés. Quantité d'observations actuelles selon dates: 54.
Source (désignation):
Les indicateurs du développement mondiale
Source (organisation):
IEA Statistics © OECD/IEA 2014 (http://www.iea.org/stats/index.asp), subject to https://www.iea.org/t&c/termsandconditions/
Catégories:
Environment
Dernière mise à jour
23 avr. 2017
Les indicateurs de changement de valeurs selon les années
Minimum:
5.562
1 janv. 1989
Maximum:
15.723
1 janv. 2012
Pour la date d''observation
Valeur
Changement absolu
Le changement par rapport à la valeur précédente
1 janv. 1961
13.785
+13.785
0.0%
1 janv. 1962
13.354
-0.431
-3.12%
1 janv. 1963
13.226
-0.128
-0.96%
1 janv. 1964
13.386
+0.16
1.21%
1 janv. 1965
12.686
-0.7
-5.23%
1 janv. 1966
11.892
-0.794
-6.26%
1 janv. 1967
11.796
-0.096
-0.8%
1 janv. 1968
11.495
-0.301
-2.56%
1 janv. 1969
11.351
-0.144
-1.25%
1 janv. 1970
10.556
-0.795
-7.01%
1 janv. 1971
10.344
-0.212
-2.01%
1 janv. 1972
9.824
-0.52
-5.03%
1 janv. 1973
9.78
-0.044
-0.44%
1 janv. 1974
9.488
-0.292
-2.98%
1 janv. 1975
9.163
-0.326
-3.43%
1 janv. 1976
9.159
-0.004
-0.04%
1 janv. 1977
8.337
-0.822
-8.97%
1 janv. 1978
8.172
-0.165
-1.98%
1 janv. 1979
7.654
-0.518
-6.34%
1 janv. 1980
7.187
-0.467
-6.1%
1 janv. 1981
6.759
-0.428
-5.95%
1 janv. 1982
6.757
-0.002
-0.03%
1 janv. 1983
6.104
-0.653
-9.66%
1 janv. 1984
6.399
+0.294
4.82%
1 janv. 1985
6.089
-0.309
-4.83%
1 janv. 1986
5.729
-0.361
-5.92%
1 janv. 1987
5.812
+0.084
1.46%
1 janv. 1988
5.681
-0.131
-2.25%
1 janv. 1989
5.562
-0.119
-2.1%
1 janv. 1990
5.76
+0.198
3.56%
1 janv. 1991
5.864
+0.104
1.81%
1 janv. 1992
6.09
+0.227
3.86%
1 janv. 1993
6.354
+0.263
4.33%
1 janv. 1994
6.163
-0.191
-3.0%
1 janv. 1995
6.465
+0.302
4.89%
1 janv. 1996
6.691
+0.227
3.51%
1 janv. 1997
7.237
+0.545
8.15%
1 janv. 1998
7.912
+0.675
9.33%
1 janv. 1999
9.028
+1.116
14.1%
1 janv. 2000
10.123
+1.095
12.13%
1 janv. 2001
9.307
-0.816
-8.06%
1 janv. 2002
9.279
-0.028
-0.3%
1 janv. 2003
9.156
-0.124
-1.33%
1 janv. 2004
9.649
+0.493
5.39%
1 janv. 2005
10.818
+1.17
12.12%
1 janv. 2006
11.644
+0.825
7.63%
1 janv. 2007
12.412
+0.768
6.6%
1 janv. 2008
13.802
+1.39
11.2%
1 janv. 2009
14.676
+0.874
6.33%
1 janv. 2010
15.329
+0.653
4.45%
1 janv. 2011
15.171
-0.158
-1.03%
1 janv. 2012
15.723
+0.551
3.63%
1 janv. 2013
15.45
-0.272
-1.73%
1 janv. 2014
14.759
-0.692
-4.48%
Classement des pays selon les statistiques actuelles par années


Commentaires: