29
/fr/
fr
AIzaSyAYiBZKx7MnpbEhh9jyipgxe19OcubqV5w
April 1, 2024
274608
United Arab Emirates
ARE
true
2
1
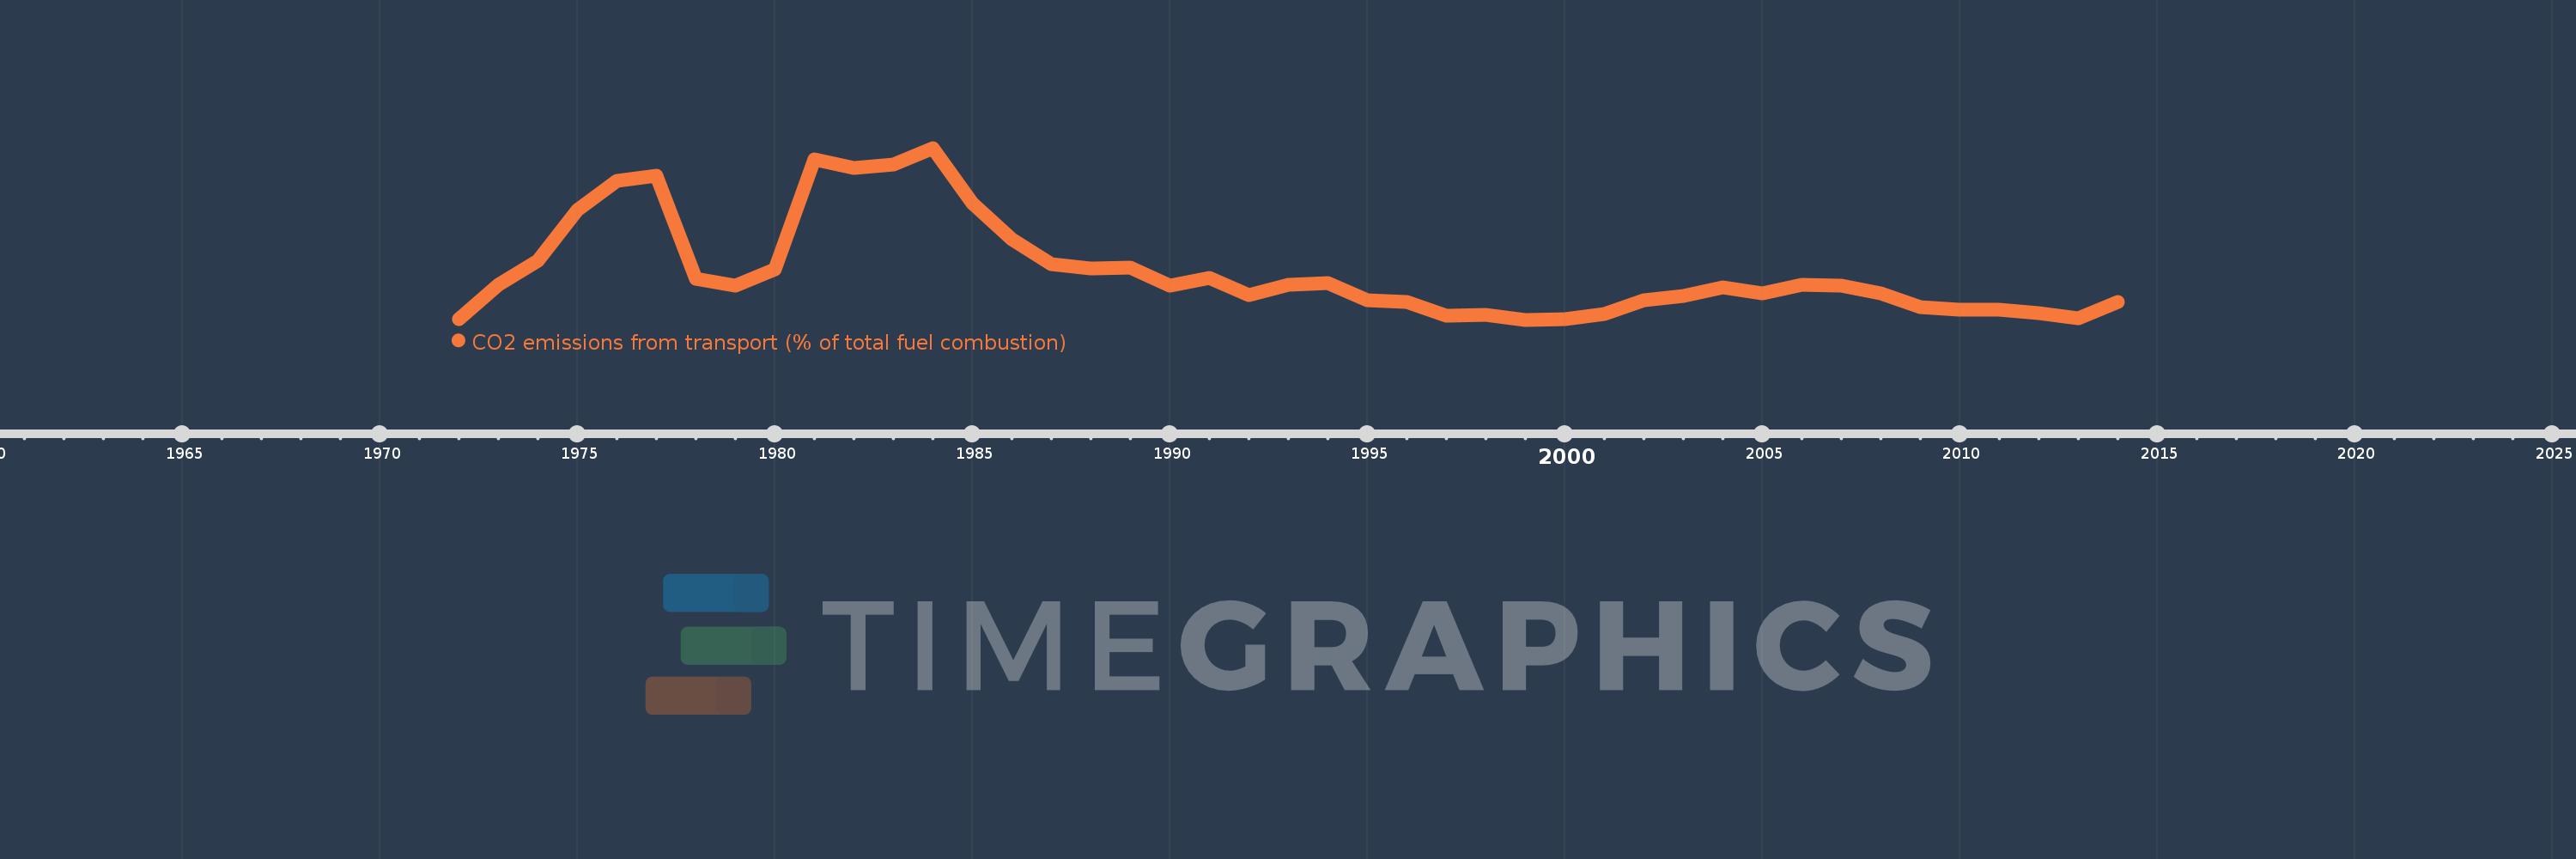
CO2 emissions from transport (% of total fuel combustion)
2014,2013,2012,2011,2010,2009,2008,2007,2006,2005,2004,2003,2002,2001,2000,1999,1998,1997,1996,1995,1994,1993,1992,1991,1990,1989,1988,1987,1986,1985,1984,1983,1982,1981,1980,1979,1978,1977,1976,1975,1974,1973,1972
Cette statistique dans les autres pays:
AlbaniaAlgeriaAngolaArab WorldArgentinaArmeniaAustraliaAustriaAzerbaijanBahrainBangladeshBelarusBelgiumBeninBoliviaBosnia and HerzegovinaBotswanaBrazilBrunei DarussalamBulgariaCambodiaCameroonCanadaCaribbean small statesCentral Europe and the BalticsChileChinaColombiaCongo, Dem. Rep.Congo, Rep.Costa RicaCote d'IvoireCroatiaCubaCuracaoCyprusCzech RepublicDenmarkDominican RepublicEarly-demographic dividendEast Asia & PacificEast Asia & Pacific (excluding high income)East Asia & Pacific (IDA & IBRD countries)EcuadorEgypt, Arab Rep.El SalvadorEritreaEstoniaEthiopiaEuro areaEurope & Central AsiaEurope & Central Asia (excluding high income)Europe & Central Asia (IDA & IBRD countries)European UnionFinlandFragile and conflict affected situationsFranceGabonGeorgiaGermanyGhanaGibraltarGreeceGuatemalaHaitiHeavily indebted poor countries (HIPC)High incomeHondurasHong Kong SAR, ChinaHungaryIBRD onlyIcelandIDA & IBRD totalIDA blendIDA onlyIDA totalIndiaIndonesiaIran, Islamic Rep.IraqIrelandIsraelItalyJamaicaJapanJordanKazakhstanKenyaKorea, Dem. People’s Rep.Korea, Rep.KosovoKuwaitKyrgyz RepublicLate-demographic dividendLatin America & Caribbean Latin America & Caribbean (excluding high income)Latin America & the Caribbean (IDA & IBRD countries)LatviaLeast developed countries: UN classificationLebanonLibyaLithuaniaLow & middle incomeLow incomeLower middle incomeLuxembourgMacedonia, FYRMalaysiaMaltaMauritiusMexicoMiddle East & North AfricaMiddle East & North Africa (excluding high income)Middle East & North Africa (IDA & IBRD countries)Middle incomeMoldovaMongoliaMontenegroMoroccoMozambiqueMyanmarNamibiaNepalNetherlandsNew ZealandNicaraguaNigerNigeriaNorth AmericaNorwayOECD membersOmanOther small statesPakistanPanamaParaguayPeruPhilippinesPolandPortugalPost-demographic dividendPre-demographic dividendQatarRomaniaRussian FederationSaudi ArabiaSenegalSerbiaSingaporeSlovak RepublicSloveniaSmall statesSouth AfricaSouth AsiaSouth Asia (IDA & IBRD)South SudanSpainSri LankaSub-Saharan Africa Sub-Saharan Africa (excluding high income)Sub-Saharan Africa (IDA & IBRD countries)SudanSwedenSwitzerlandSyrian Arab RepublicTajikistanTanzaniaThailandTogoTrinidad and TobagoTunisiaTurkeyTurkmenistanUkraineUnited Arab EmiratesUnited KingdomUnited StatesUpper middle incomeUruguayUzbekistanVenezuela, RBVietnamWorldYemen, Rep.ZambiaZimbabwe La ligne de temps
Cette échelle de temps montre un graphique de 1972 année à 2014 année United Arab Emirates. Les données jusqu'à 1971 année ne sont pas présentés. Quantité d'observations actuelles selon dates: 43.
Source (désignation):
Les indicateurs du développement mondiale
Source (organisation):
IEA Statistics © OECD/IEA 2014 (http://www.iea.org/stats/index.asp), subject to https://www.iea.org/t&c/termsandconditions/
Catégories:
Environment
Dernière mise à jour
23 avr. 2017
Les indicateurs de changement de valeurs selon les années
Minimum:
16.631
1 janv. 1999
Maximum:
37.586
1 janv. 1984
Pour la date d''observation
Valeur
Changement absolu
Le changement par rapport à la valeur précédente
1 janv. 1972
16.667
+16.667
0.0%
1 janv. 1973
20.93
+4.264
25.58%
1 janv. 1974
23.839
+2.909
13.9%
1 janv. 1975
29.97
+6.131
25.72%
1 janv. 1976
33.537
+3.566
11.9%
1 janv. 1977
34.223
+0.686
2.05%
1 janv. 1978
21.604
-12.619
-36.87%
1 janv. 1979
20.816
-0.787
-3.64%
1 janv. 1980
22.774
+1.958
9.41%
1 janv. 1981
36.212
+13.438
59.0%
1 janv. 1982
35.105
-1.107
-3.06%
1 janv. 1983
35.524
+0.419
1.19%
1 janv. 1984
37.586
+2.062
5.8%
1 janv. 1985
30.803
-6.783
-18.05%
1 janv. 1986
26.418
-4.385
-14.24%
1 janv. 1987
23.438
-2.979
-11.28%
1 janv. 1988
22.908
-0.53
-2.26%
1 janv. 1989
23.036
+0.128
0.56%
1 janv. 1990
20.8
-2.236
-9.71%
1 janv. 1991
21.766
+0.965
4.64%
1 janv. 1992
19.628
-2.138
-9.82%
1 janv. 1993
20.866
+1.238
6.31%
1 janv. 1994
21.144
+0.278
1.33%
1 janv. 1995
19.033
-2.111
-9.99%
1 janv. 1996
18.811
-0.222
-1.17%
1 janv. 1997
17.107
-1.704
-9.06%
1 janv. 1998
17.221
+0.114
0.66%
1 janv. 1999
16.631
-0.59
-3.43%
1 janv. 2000
16.656
+0.025
0.15%
1 janv. 2001
17.364
+0.708
4.25%
1 janv. 2002
18.959
+1.595
9.18%
1 janv. 2003
19.499
+0.54
2.85%
1 janv. 2004
20.631
+1.132
5.81%
1 janv. 2005
19.836
-0.795
-3.85%
1 janv. 2006
20.926
+1.09
5.49%
1 janv. 2007
20.811
-0.115
-0.55%
1 janv. 2008
19.799
-1.012
-4.86%
1 janv. 2009
18.181
-1.618
-8.17%
1 janv. 2010
17.894
-0.287
-1.58%
1 janv. 2011
17.848
-0.045
-0.25%
1 janv. 2012
17.463
-0.386
-2.16%
1 janv. 2013
16.764
-0.698
-4.0%
1 janv. 2014
18.8
+2.035
12.14%
Classement des pays selon les statistiques actuelles par années


Commentaires: