30
/fr/
AIzaSyAYiBZKx7MnpbEhh9jyipgxe19OcubqV5w
April 1, 2024
284108
West Bank and Gaza
PSE
true
2
1
Stocks traded, total value (current US$)
2016,2015,2014,2013,2012,2011,2010,2009,2008,2007,2006,2005,2004,2003,2002,2001,2000
Download
Bibliothèque de statistiques globales →West Bank and Gaza →

Stocks traded, total value (current US$)

Cette statistique dans les autres pays:

Arab WorldArgentinaArmeniaAustraliaAustriaBahrainBangladeshBarbadosBelgiumBermudaBoliviaBotswanaBrazilBulgariaCanadaCayman IslandsCentral Europe and the BalticsChannel IslandsChileChinaColombiaCosta RicaCote d'IvoireCroatiaCyprusCzech RepublicDenmarkEarly-demographic dividendEast Asia & PacificEast Asia & Pacific (excluding high income)East Asia & Pacific (IDA & IBRD countries)EcuadorEgypt, Arab Rep.El SalvadorEstoniaEuro areaEurope & Central AsiaEurope & Central Asia (excluding high income)Europe & Central Asia (IDA & IBRD countries)European UnionFijiFinlandFranceGeorgiaGermanyGhanaGreeceGuyanaHigh incomeHong Kong SAR, ChinaHungaryIBRD onlyIcelandIDA & IBRD totalIDA blendIDA totalIndiaIndonesiaIran, Islamic Rep.IrelandIsraelItalyJamaicaJapanJordanKazakhstanKenyaKorea, Rep.KuwaitKyrgyz RepublicLate-demographic dividendLatin America & Caribbean Latin America & Caribbean (excluding high income)Latin America & the Caribbean (IDA & IBRD countries)LatviaLebanonLithuaniaLow & middle incomeLower middle incomeLuxembourgMacedonia, FYRMalawiMalaysiaMaltaMauritiusMexicoMiddle East & North AfricaMiddle East & North Africa (excluding high income)Middle East & North Africa (IDA & IBRD countries)Middle incomeMoldovaMongoliaMontenegroMoroccoNamibiaNetherlandsNew ZealandNigeriaNorth AmericaNorwayOECD membersOmanOther small statesPakistanPanamaPapua New GuineaParaguayPeruPhilippinesPolandPortugalPost-demographic dividendQatarRomaniaRussian FederationSaudi ArabiaSerbiaSeychellesSingaporeSlovak RepublicSloveniaSouth AfricaSouth AsiaSouth Asia (IDA & IBRD)SpainSri LankaSt. Kitts and NevisSub-Saharan Africa Sub-Saharan Africa (excluding high income)Sub-Saharan Africa (IDA & IBRD countries)SwazilandSwedenSwitzerlandTanzaniaThailandTrinidad and TobagoTunisiaTurkeyUgandaUkraineUnited Arab EmiratesUnited KingdomUnited StatesUpper middle incomeUruguayUzbekistanVenezuela, RBVietnamWest Bank and GazaWorldZambiaZimbabwe

La ligne de temps

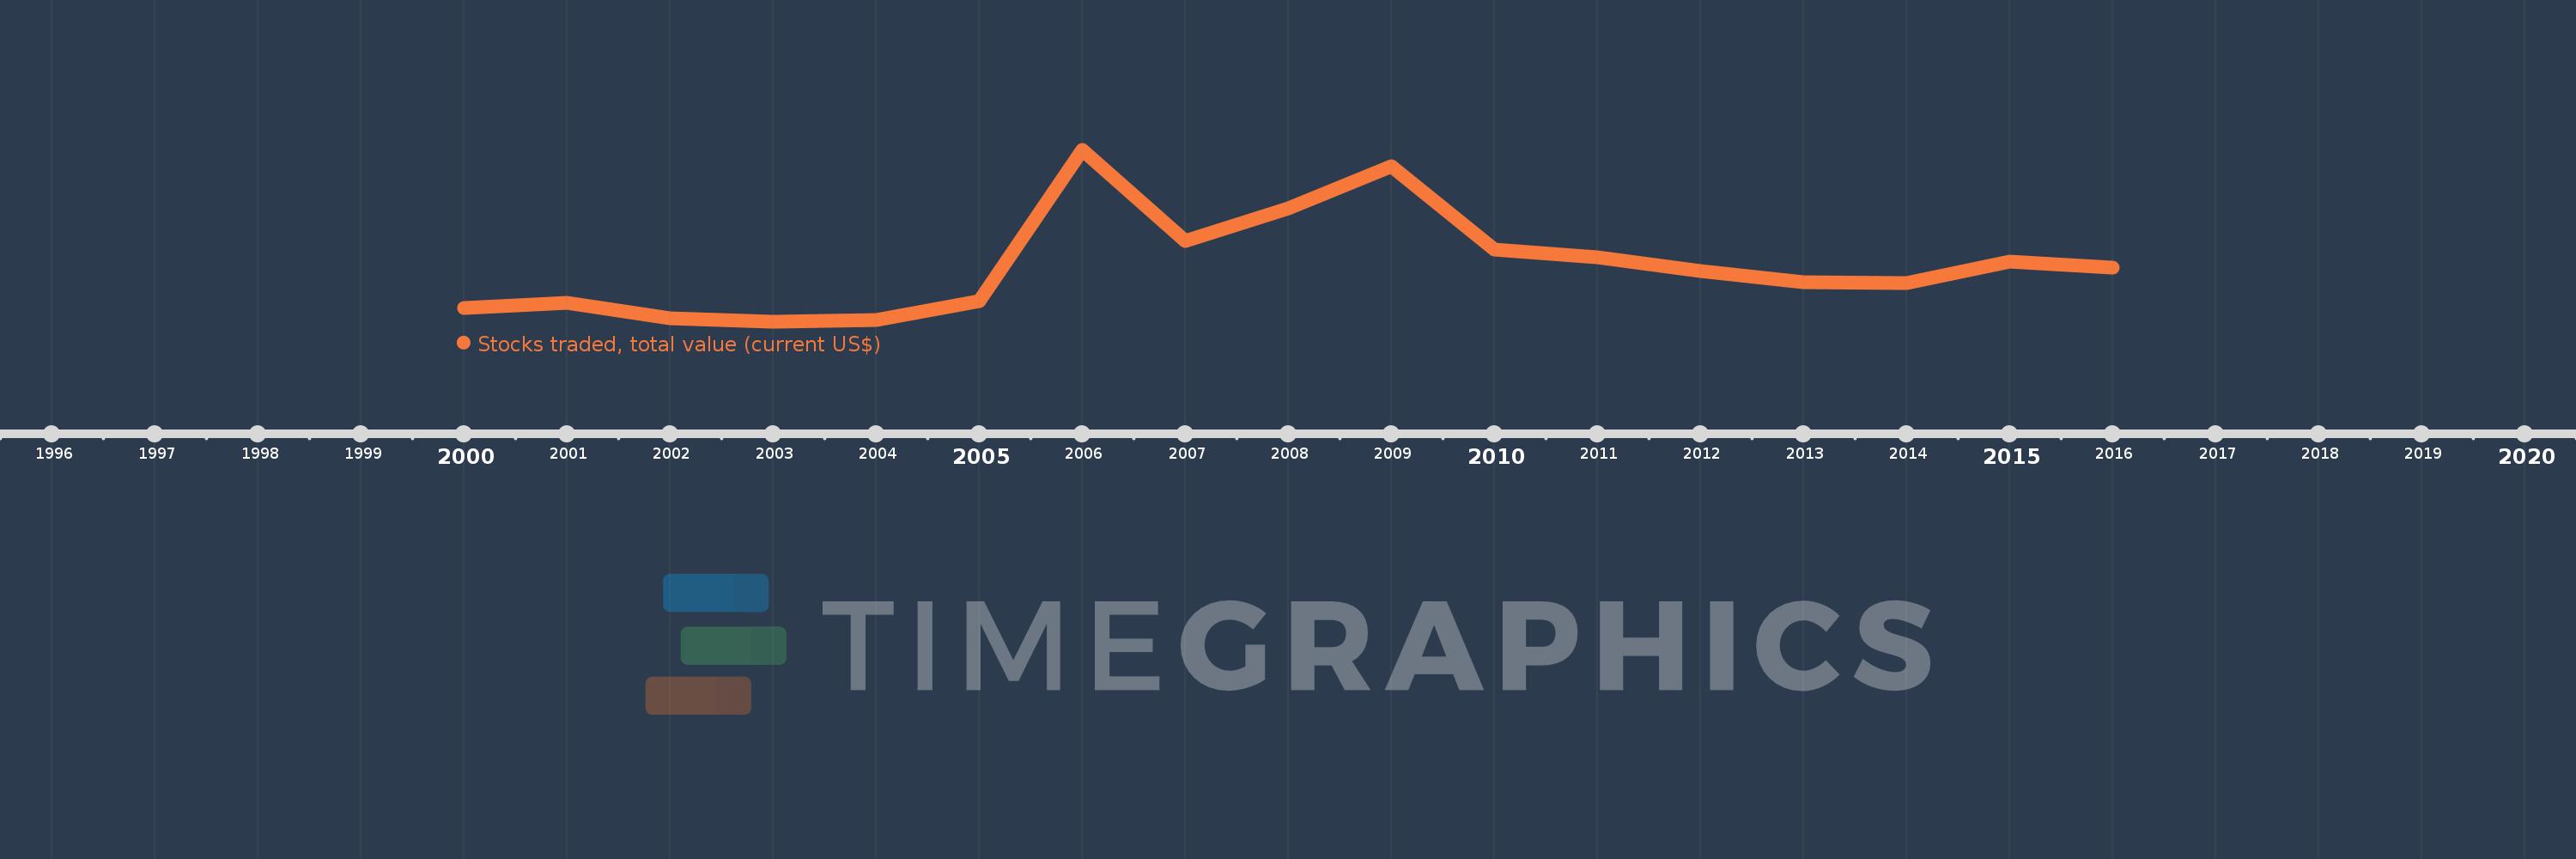
Cette échelle de temps montre un graphique de 2000 année à 2016 année West Bank and Gaza. Les données jusqu'à 1999 année ne sont pas présentés. Quantité d'observations actuelles selon dates: 17.

Source (désignation):

Les indicateurs du développement mondiale

Source (organisation):

World Federation of Exchanges database.

Catégories:

Financial Sector

Dernière mise à jour

23 avr. 2017

Les indicateurs de changement de valeurs selon les années

En moyenne:
332.592 mln.
Minimum:
31.97 mln.
1 janv. 2003
Maximum:
942.8 mln.
1 janv. 2006
Pour la date d''observation
Valeur
Changement absolu
Le changement par rapport à la valeur précédente
1 janv. 2000
106.62 mln.
+106.62 mln.
0.0%
1 janv. 2001
134.14 mln.
+27.52 mln.
25.81%
1 janv. 2002
52.88 mln.
-81.26 mln.
-60.58%
1 janv. 2003
31.97 mln.
-20.91 mln.
-39.54%
1 janv. 2004
41.35 mln.
+9.38 mln.
29.34%
1 janv. 2005
142.23 mln.
+100.88 mln.
243.97%
1 janv. 2006
942.8 mln.
+800.57 mln.
562.87%
1 janv. 2007
462.0 mln.
-480.8 mln.
-51.0%
1 janv. 2008
635.64 mln.
+173.64 mln.
37.58%
1 janv. 2009
856.54 mln.
+220.9 mln.
34.75%
1 janv. 2010
413.93 mln.
-442.61 mln.
-51.67%
1 janv. 2011
373.94 mln.
-39.99 mln.
-9.66%
1 janv. 2012
302.47 mln.
-71.47 mln.
-19.11%
1 janv. 2013
242.92 mln.
-59.55 mln.
-19.69%
1 janv. 2014
240.35 mln.
-2.57 mln.
-1.06%
1 janv. 2015
353.91 mln.
+113.56 mln.
47.25%
1 janv. 2016
320.38 mln.
-33.53 mln.
-9.47%

Classement des pays selon les statistiques actuelles par années