30
/fr/
AIzaSyAYiBZKx7MnpbEhh9jyipgxe19OcubqV5w
April 1, 2024
219085
Panama
PAN
true
2
1
Stocks traded, total value (current US$)
2015,2014,2013,2012,2011,2010,2009,2008,2007,2006,2005,2004,2003,2002,2001,2000,1999,1998,1997,1996,1995,1994
Download
Bibliothèque de statistiques globales →Panama →

Stocks traded, total value (current US$)

Cette statistique dans les autres pays:

Arab WorldArgentinaArmeniaAustraliaAustriaBahrainBangladeshBarbadosBelgiumBermudaBoliviaBotswanaBrazilBulgariaCanadaCayman IslandsCentral Europe and the BalticsChannel IslandsChileChinaColombiaCosta RicaCote d'IvoireCroatiaCyprusCzech RepublicDenmarkEarly-demographic dividendEast Asia & PacificEast Asia & Pacific (excluding high income)East Asia & Pacific (IDA & IBRD countries)EcuadorEgypt, Arab Rep.El SalvadorEstoniaEuro areaEurope & Central AsiaEurope & Central Asia (excluding high income)Europe & Central Asia (IDA & IBRD countries)European UnionFijiFinlandFranceGeorgiaGermanyGhanaGreeceGuyanaHigh incomeHong Kong SAR, ChinaHungaryIBRD onlyIcelandIDA & IBRD totalIDA blendIDA totalIndiaIndonesiaIran, Islamic Rep.IrelandIsraelItalyJamaicaJapanJordanKazakhstanKenyaKorea, Rep.KuwaitKyrgyz RepublicLate-demographic dividendLatin America & Caribbean Latin America & Caribbean (excluding high income)Latin America & the Caribbean (IDA & IBRD countries)LatviaLebanonLithuaniaLow & middle incomeLower middle incomeLuxembourgMacedonia, FYRMalawiMalaysiaMaltaMauritiusMexicoMiddle East & North AfricaMiddle East & North Africa (excluding high income)Middle East & North Africa (IDA & IBRD countries)Middle incomeMoldovaMongoliaMontenegroMoroccoNamibiaNetherlandsNew ZealandNigeriaNorth AmericaNorwayOECD membersOmanOther small statesPakistanPanamaPapua New GuineaParaguayPeruPhilippinesPolandPortugalPost-demographic dividendQatarRomaniaRussian FederationSaudi ArabiaSerbiaSeychellesSingaporeSlovak RepublicSloveniaSouth AfricaSouth AsiaSouth Asia (IDA & IBRD)SpainSri LankaSt. Kitts and NevisSub-Saharan Africa Sub-Saharan Africa (excluding high income)Sub-Saharan Africa (IDA & IBRD countries)SwazilandSwedenSwitzerlandTanzaniaThailandTrinidad and TobagoTunisiaTurkeyUgandaUkraineUnited Arab EmiratesUnited KingdomUnited StatesUpper middle incomeUruguayUzbekistanVenezuela, RBVietnamWest Bank and GazaWorldZambiaZimbabwe

La ligne de temps

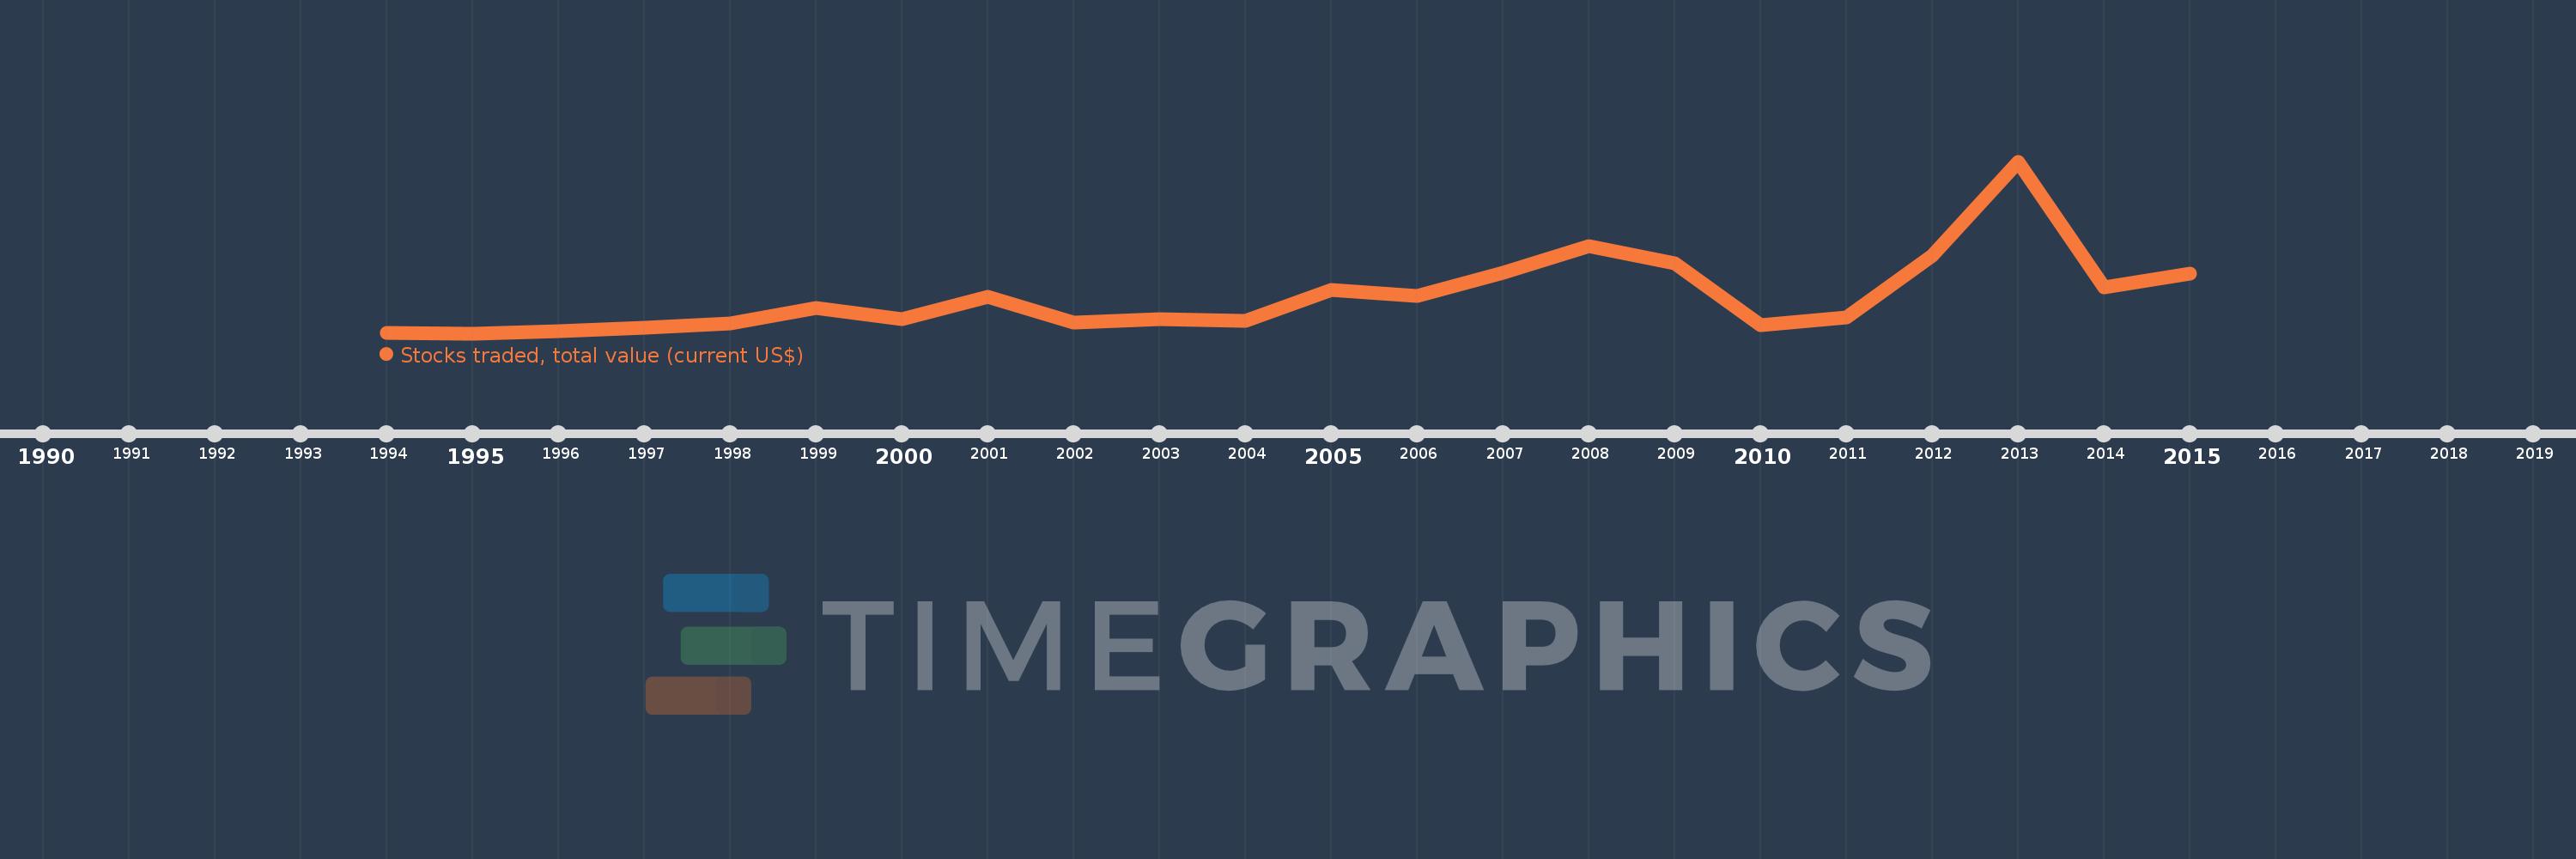
Cette échelle de temps montre un graphique de 1994 année à 2015 année Panama. Les données jusqu'à 1993 année ne sont pas présentés. Quantité d'observations actuelles selon dates: 22.

Source (désignation):

Les indicateurs du développement mondiale

Source (organisation):

World Federation of Exchanges database.

Catégories:

Financial Sector

Dernière mise à jour

23 avr. 2017

Les indicateurs de changement de valeurs selon les années

En moyenne:
153.324 mln.
Minimum:
0.0
1 janv. 1995
Maximum:
716.4 mln.
1 janv. 2013
Pour la date d''observation
Valeur
Changement absolu
Le changement par rapport à la valeur précédente
1 janv. 1994
1.8 mln.
+1.8 mln.
0.0%
1 janv. 1995
0.0
-1.8 mln.
-100.0%
1 janv. 1996
8.059 mln.
+8.059 mln.
%
1 janv. 1997
23.57 mln.
+15.511 mln.
192.45%
1 janv. 1998
42.2 mln.
+18.63 mln.
79.04%
1 janv. 1999
106.2 mln.
+64.0 mln.
151.66%
1 janv. 2000
57.7 mln.
-48.5 mln.
-45.67%
1 janv. 2001
153.6 mln.
+95.9 mln.
166.2%
1 janv. 2002
44.8 mln.
-108.8 mln.
-70.83%
1 janv. 2003
58.9 mln.
+14.1 mln.
31.47%
1 janv. 2004
53.2 mln.
-5.7 mln.
-9.68%
1 janv. 2005
180.5 mln.
+127.3 mln.
239.29%
1 janv. 2006
156.4 mln.
-24.1 mln.
-13.35%
1 janv. 2007
253.4 mln.
+97.0 mln.
62.02%
1 janv. 2008
362.5 mln.
+109.1 mln.
43.05%
1 janv. 2009
290.8 mln.
-71.7 mln.
-19.78%
1 janv. 2010
32.3 mln.
-258.5 mln.
-88.89%
1 janv. 2011
68.0 mln.
+35.7 mln.
110.53%
1 janv. 2012
324.0 mln.
+256.0 mln.
376.47%
1 janv. 2013
716.4 mln.
+392.4 mln.
121.11%
1 janv. 2014
190.5 mln.
-525.9 mln.
-73.41%
1 janv. 2015
248.3 mln.
+57.8 mln.
30.34%

Classement des pays selon les statistiques actuelles par années