30
/fr/
AIzaSyAYiBZKx7MnpbEhh9jyipgxe19OcubqV5w
April 1, 2024
113008
Costa Rica
CRI
true
2
1
Stocks traded, total value (current US$)
2014,2013,2012,2011,2010,2009,2008,2007,2006,2005,2004,2000,1999,1998,1997,1996,1995,1994
Download
Bibliothèque de statistiques globales →Costa Rica →

Stocks traded, total value (current US$)

Cette statistique dans les autres pays:

Arab WorldArgentinaArmeniaAustraliaAustriaBahrainBangladeshBarbadosBelgiumBermudaBoliviaBotswanaBrazilBulgariaCanadaCayman IslandsCentral Europe and the BalticsChannel IslandsChileChinaColombiaCosta RicaCote d'IvoireCroatiaCyprusCzech RepublicDenmarkEarly-demographic dividendEast Asia & PacificEast Asia & Pacific (excluding high income)East Asia & Pacific (IDA & IBRD countries)EcuadorEgypt, Arab Rep.El SalvadorEstoniaEuro areaEurope & Central AsiaEurope & Central Asia (excluding high income)Europe & Central Asia (IDA & IBRD countries)European UnionFijiFinlandFranceGeorgiaGermanyGhanaGreeceGuyanaHigh incomeHong Kong SAR, ChinaHungaryIBRD onlyIcelandIDA & IBRD totalIDA blendIDA totalIndiaIndonesiaIran, Islamic Rep.IrelandIsraelItalyJamaicaJapanJordanKazakhstanKenyaKorea, Rep.KuwaitKyrgyz RepublicLate-demographic dividendLatin America & Caribbean Latin America & Caribbean (excluding high income)Latin America & the Caribbean (IDA & IBRD countries)LatviaLebanonLithuaniaLow & middle incomeLower middle incomeLuxembourgMacedonia, FYRMalawiMalaysiaMaltaMauritiusMexicoMiddle East & North AfricaMiddle East & North Africa (excluding high income)Middle East & North Africa (IDA & IBRD countries)Middle incomeMoldovaMongoliaMontenegroMoroccoNamibiaNetherlandsNew ZealandNigeriaNorth AmericaNorwayOECD membersOmanOther small statesPakistanPanamaPapua New GuineaParaguayPeruPhilippinesPolandPortugalPost-demographic dividendQatarRomaniaRussian FederationSaudi ArabiaSerbiaSeychellesSingaporeSlovak RepublicSloveniaSouth AfricaSouth AsiaSouth Asia (IDA & IBRD)SpainSri LankaSt. Kitts and NevisSub-Saharan Africa Sub-Saharan Africa (excluding high income)Sub-Saharan Africa (IDA & IBRD countries)SwazilandSwedenSwitzerlandTanzaniaThailandTrinidad and TobagoTunisiaTurkeyUgandaUkraineUnited Arab EmiratesUnited KingdomUnited StatesUpper middle incomeUruguayUzbekistanVenezuela, RBVietnamWest Bank and GazaWorldZambiaZimbabwe

La ligne de temps

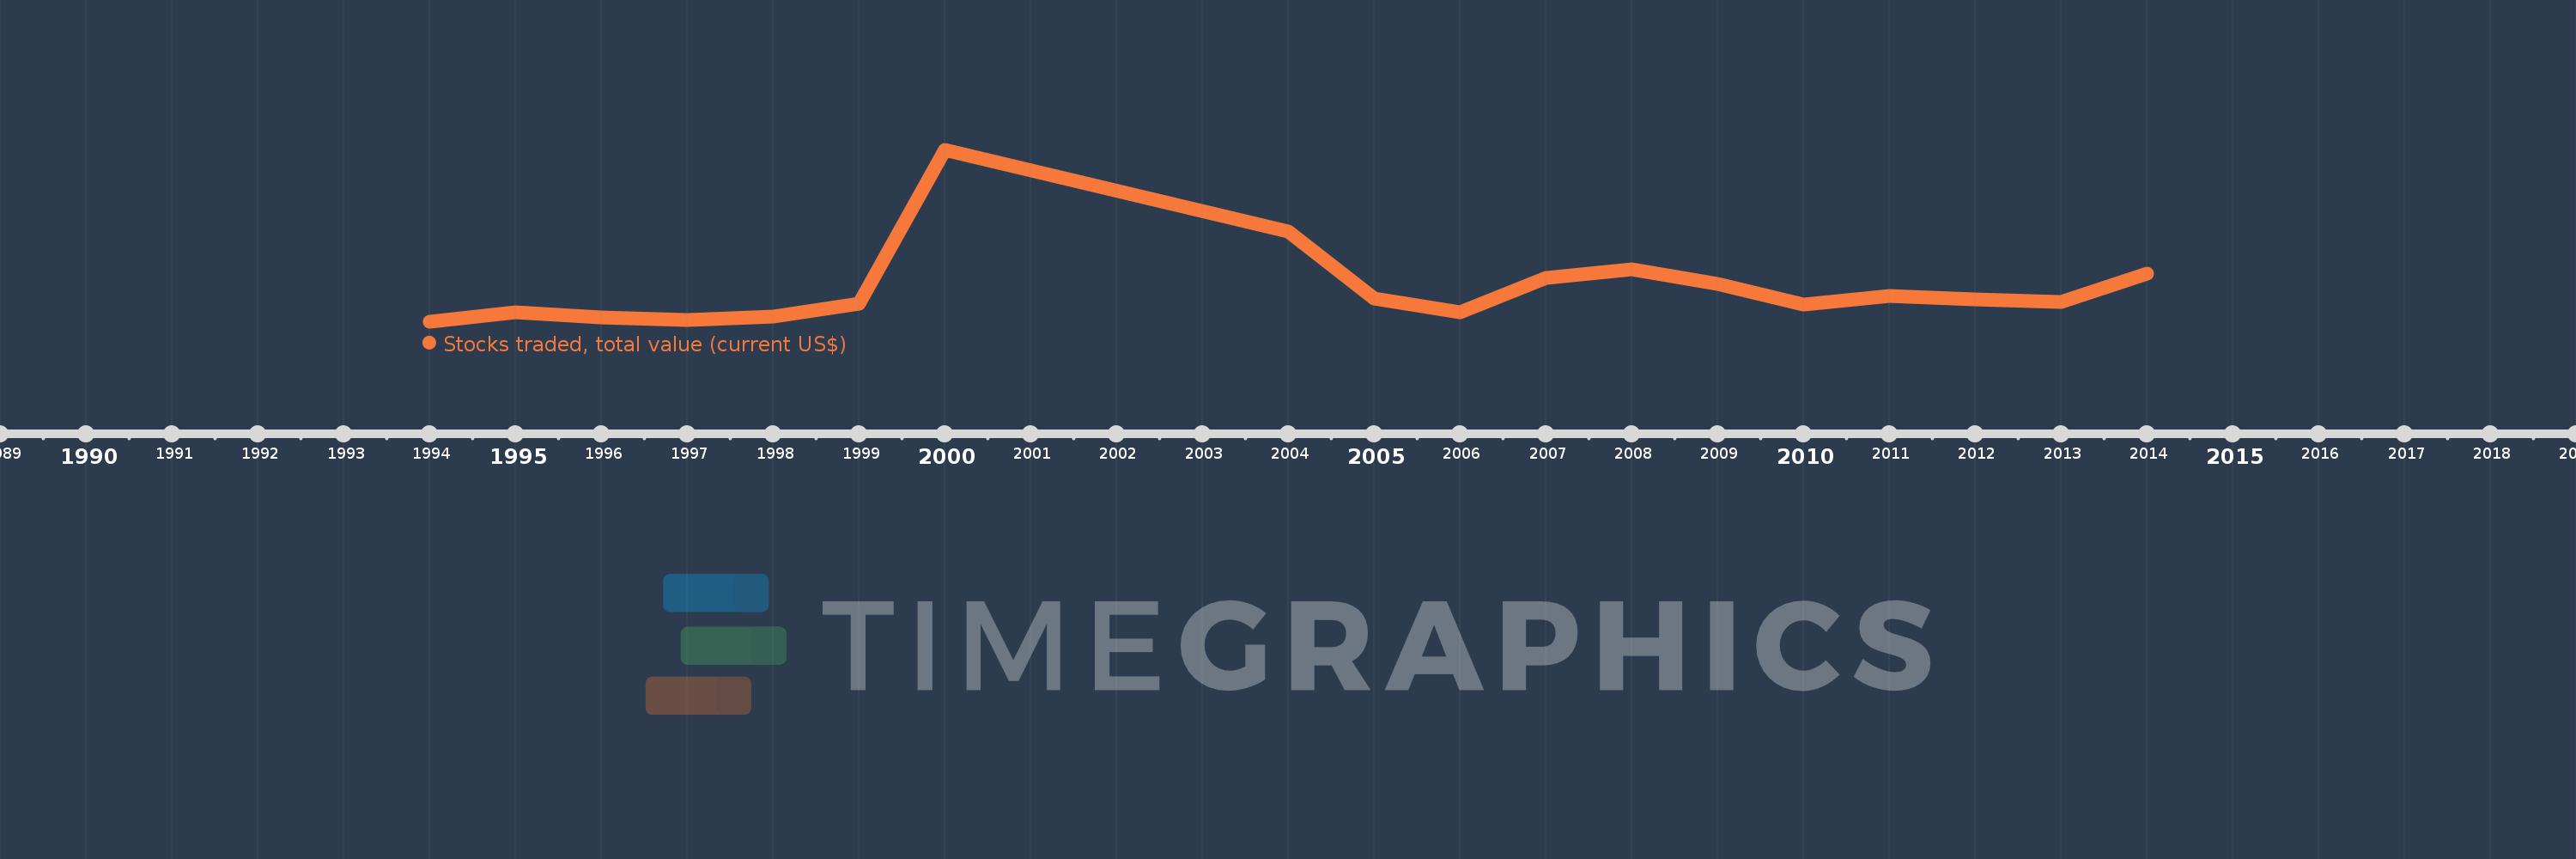
Cette échelle de temps montre un graphique de 1994 année à 2014 année Costa Rica. Les données jusqu'à 1993 année ne sont pas présentés. Quantité d'observations actuelles selon dates: 18.

Source (désignation):

Les indicateurs du développement mondiale

Source (organisation):

World Federation of Exchanges database.

Catégories:

Financial Sector

Dernière mise à jour

23 avr. 2017

Les indicateurs de changement de valeurs selon les années

En moyenne:
49.526 mln.
Minimum:
11.0 mln.
1 janv. 1994
Maximum:
208.32 mln.
1 janv. 2000
Pour la date d''observation
Valeur
Changement absolu
Le changement par rapport à la valeur précédente
1 janv. 1994
11.0 mln.
+11.0 mln.
0.0%
1 janv. 1995
21.7 mln.
+10.7 mln.
97.27%
1 janv. 1996
15.74 mln.
-5.96 mln.
-27.47%
1 janv. 1997
13.51 mln.
-2.23 mln.
-14.17%
1 janv. 1998
17.25 mln.
+3.74 mln.
27.68%
1 janv. 1999
32.36 mln.
+15.11 mln.
87.59%
1 janv. 2000
208.32 mln.
+175.96 mln.
543.76%
1 janv. 2004
114.9 mln.
-93.42 mln.
-44.84%
1 janv. 2005
37.58 mln.
-77.32 mln.
-67.29%
1 janv. 2006
21.9 mln.
-15.68 mln.
-41.72%
1 janv. 2007
61.83 mln.
+39.93 mln.
182.33%
1 janv. 2008
71.69 mln.
+9.86 mln.
15.95%
1 janv. 2009
54.46 mln.
-17.23 mln.
-24.03%
1 janv. 2010
31.34 mln.
-23.12 mln.
-42.45%
1 janv. 2011
41.35 mln.
+10.01 mln.
31.94%
1 janv. 2012
36.83 mln.
-4.52 mln.
-10.93%
1 janv. 2013
33.6 mln.
-3.23 mln.
-8.77%
1 janv. 2014
66.1 mln.
+32.5 mln.
96.73%

Classement des pays selon les statistiques actuelles par années