30
/fr/
AIzaSyAYiBZKx7MnpbEhh9jyipgxe19OcubqV5w
April 1, 2024
205861
Namibia
NAM
true
2
1
Stocks traded, total value (current US$)
2015,2014,2013,2012,2011,2010,2009,2008,2007,2006,2005,2004,2003,2002,2001,2000,1999,1998,1997,1996,1995
Download
Bibliothèque de statistiques globales →Namibia →

Stocks traded, total value (current US$)

Cette statistique dans les autres pays:

Arab WorldArgentinaArmeniaAustraliaAustriaBahrainBangladeshBarbadosBelgiumBermudaBoliviaBotswanaBrazilBulgariaCanadaCayman IslandsCentral Europe and the BalticsChannel IslandsChileChinaColombiaCosta RicaCote d'IvoireCroatiaCyprusCzech RepublicDenmarkEarly-demographic dividendEast Asia & PacificEast Asia & Pacific (excluding high income)East Asia & Pacific (IDA & IBRD countries)EcuadorEgypt, Arab Rep.El SalvadorEstoniaEuro areaEurope & Central AsiaEurope & Central Asia (excluding high income)Europe & Central Asia (IDA & IBRD countries)European UnionFijiFinlandFranceGeorgiaGermanyGhanaGreeceGuyanaHigh incomeHong Kong SAR, ChinaHungaryIBRD onlyIcelandIDA & IBRD totalIDA blendIDA totalIndiaIndonesiaIran, Islamic Rep.IrelandIsraelItalyJamaicaJapanJordanKazakhstanKenyaKorea, Rep.KuwaitKyrgyz RepublicLate-demographic dividendLatin America & Caribbean Latin America & Caribbean (excluding high income)Latin America & the Caribbean (IDA & IBRD countries)LatviaLebanonLithuaniaLow & middle incomeLower middle incomeLuxembourgMacedonia, FYRMalawiMalaysiaMaltaMauritiusMexicoMiddle East & North AfricaMiddle East & North Africa (excluding high income)Middle East & North Africa (IDA & IBRD countries)Middle incomeMoldovaMongoliaMontenegroMoroccoNamibiaNetherlandsNew ZealandNigeriaNorth AmericaNorwayOECD membersOmanOther small statesPakistanPanamaPapua New GuineaParaguayPeruPhilippinesPolandPortugalPost-demographic dividendQatarRomaniaRussian FederationSaudi ArabiaSerbiaSeychellesSingaporeSlovak RepublicSloveniaSouth AfricaSouth AsiaSouth Asia (IDA & IBRD)SpainSri LankaSt. Kitts and NevisSub-Saharan Africa Sub-Saharan Africa (excluding high income)Sub-Saharan Africa (IDA & IBRD countries)SwazilandSwedenSwitzerlandTanzaniaThailandTrinidad and TobagoTunisiaTurkeyUgandaUkraineUnited Arab EmiratesUnited KingdomUnited StatesUpper middle incomeUruguayUzbekistanVenezuela, RBVietnamWest Bank and GazaWorldZambiaZimbabwe

La ligne de temps

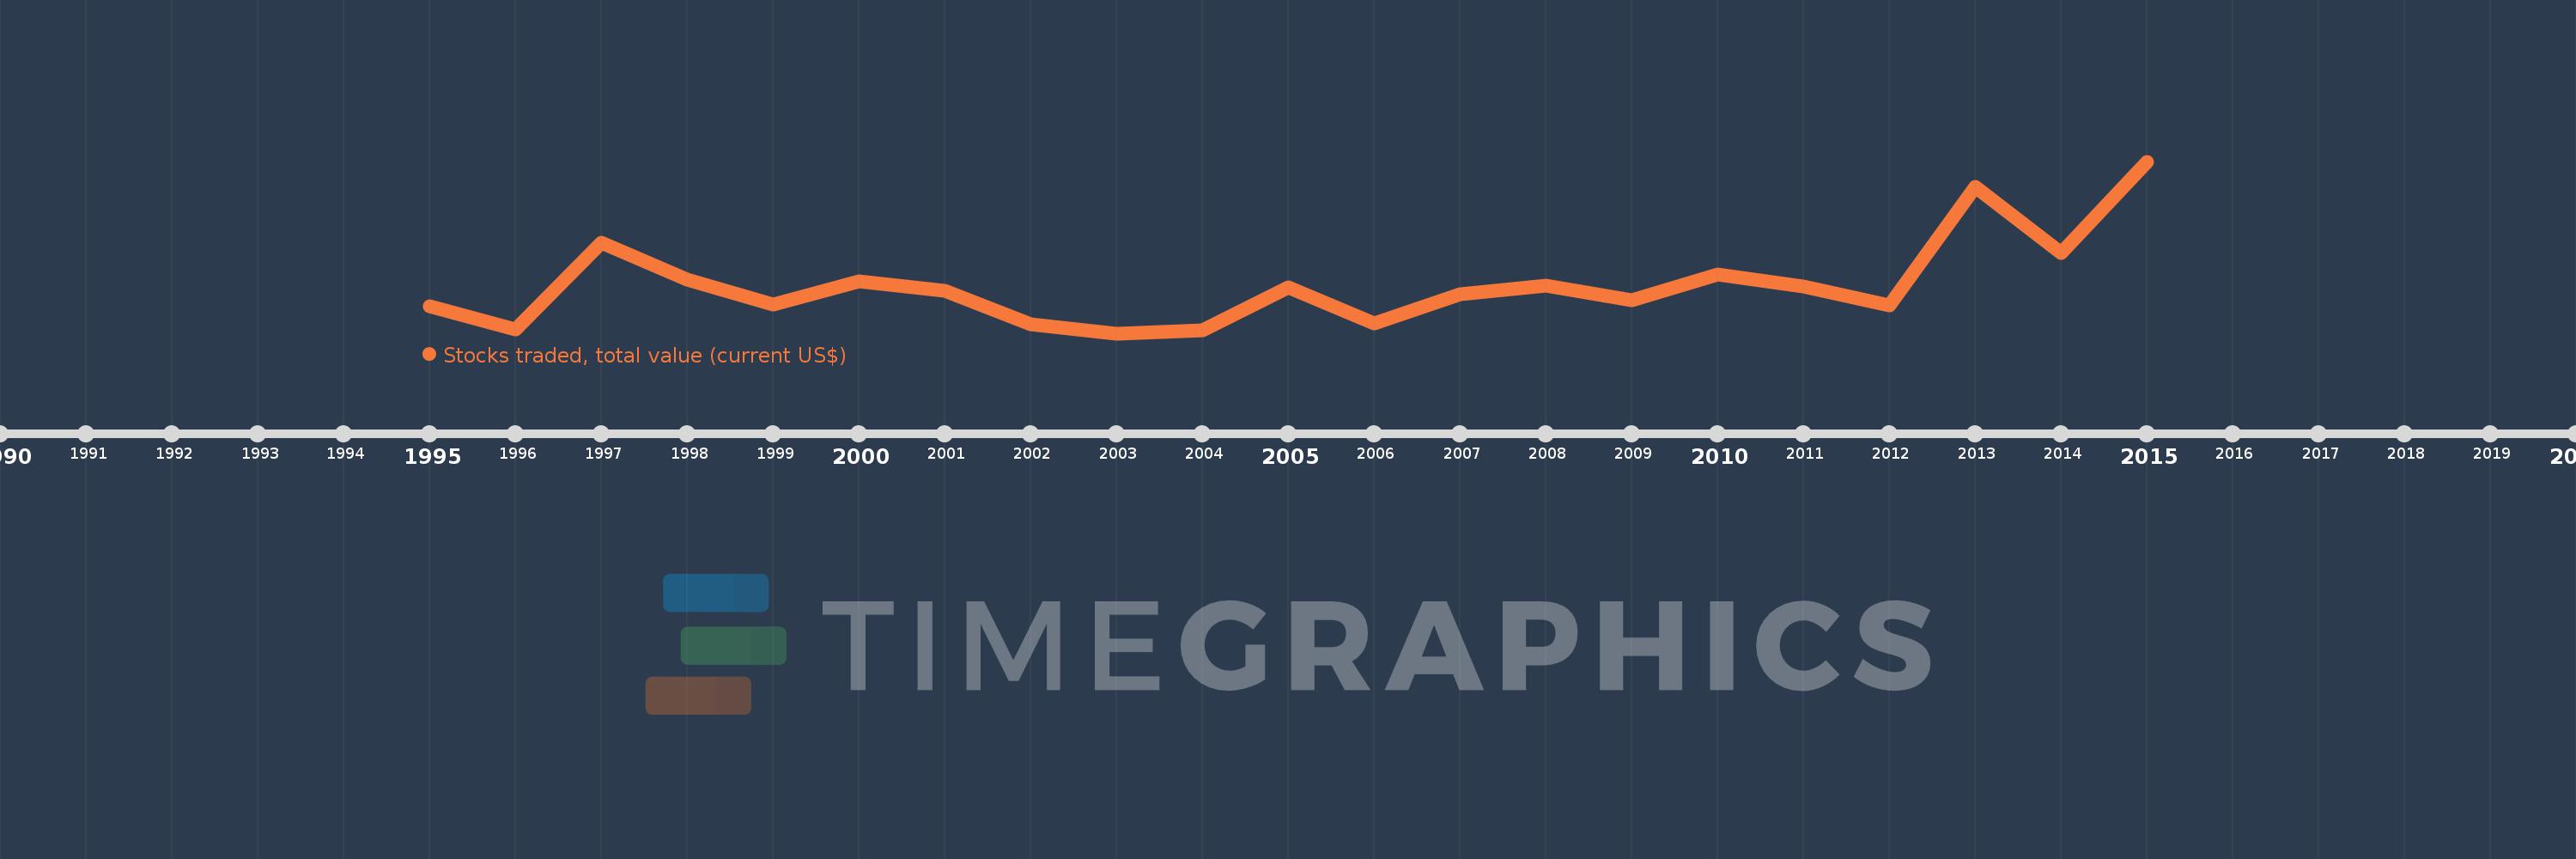
Cette échelle de temps montre un graphique de 1995 année à 2015 année Namibia. Les données jusqu'à 1994 année ne sont pas présentés. Quantité d'observations actuelles selon dates: 21.

Source (désignation):

Les indicateurs du développement mondiale

Source (organisation):

World Federation of Exchanges database.

Catégories:

Financial Sector

Dernière mise à jour

23 avr. 2017

Les indicateurs de changement de valeurs selon les années

En moyenne:
20.885 mln.
Minimum:
1.62 mln.
1 janv. 2003
Maximum:
69.82 mln.
1 janv. 2015
Pour la date d''observation
Valeur
Changement absolu
Le changement par rapport à la valeur précédente
1 janv. 1995
12.2 mln.
+12.2 mln.
0.0%
1 janv. 1996
2.99 mln.
-9.21 mln.
-75.49%
1 janv. 1997
37.71 mln.
+34.72 mln.
1.16 milles%
1 janv. 1998
23.1 mln.
-14.61 mln.
-38.74%
1 janv. 1999
12.98 mln.
-10.12 mln.
-43.81%
1 janv. 2000
22.38 mln.
+9.4 mln.
72.42%
1 janv. 2001
18.52 mln.
-3.86 mln.
-17.25%
1 janv. 2002
5.2 mln.
-13.32 mln.
-71.92%
1 janv. 2003
1.62 mln.
-3.58 mln.
-68.85%
1 janv. 2004
2.74 mln.
+1.12 mln.
69.14%
1 janv. 2005
19.88 mln.
+17.14 mln.
625.55%
1 janv. 2006
5.52 mln.
-14.36 mln.
-72.23%
1 janv. 2007
17.3 mln.
+11.78 mln.
213.41%
1 janv. 2008
20.48 mln.
+3.18 mln.
18.38%
1 janv. 2009
14.65 mln.
-5.83 mln.
-28.47%
1 janv. 2010
24.99 mln.
+10.34 mln.
70.58%
1 janv. 2011
20.25 mln.
-4.74 mln.
-18.97%
1 janv. 2012
12.76 mln.
-7.49 mln.
-36.99%
1 janv. 2013
59.9 mln.
+47.14 mln.
369.44%
1 janv. 2014
33.6 mln.
-26.3 mln.
-43.91%
1 janv. 2015
69.82 mln.
+36.22 mln.
107.8%

Classement des pays selon les statistiques actuelles par années