30
/fr/
AIzaSyAYiBZKx7MnpbEhh9jyipgxe19OcubqV5w
April 1, 2024
117436
Cyprus
CYP
true
2
1
Stocks traded, total value (current US$)
2016,2015,2014,2013,2012,2011,2010,2009,2008,2007,2006,2005,2004,2003,2002,2001,2000,1999,1998,1997,1996,1995,1994
Download
Bibliothèque de statistiques globales →Cyprus →

Stocks traded, total value (current US$)

Cette statistique dans les autres pays:

Arab WorldArgentinaArmeniaAustraliaAustriaBahrainBangladeshBarbadosBelgiumBermudaBoliviaBotswanaBrazilBulgariaCanadaCayman IslandsCentral Europe and the BalticsChannel IslandsChileChinaColombiaCosta RicaCote d'IvoireCroatiaCyprusCzech RepublicDenmarkEarly-demographic dividendEast Asia & PacificEast Asia & Pacific (excluding high income)East Asia & Pacific (IDA & IBRD countries)EcuadorEgypt, Arab Rep.El SalvadorEstoniaEuro areaEurope & Central AsiaEurope & Central Asia (excluding high income)Europe & Central Asia (IDA & IBRD countries)European UnionFijiFinlandFranceGeorgiaGermanyGhanaGreeceGuyanaHigh incomeHong Kong SAR, ChinaHungaryIBRD onlyIcelandIDA & IBRD totalIDA blendIDA totalIndiaIndonesiaIran, Islamic Rep.IrelandIsraelItalyJamaicaJapanJordanKazakhstanKenyaKorea, Rep.KuwaitKyrgyz RepublicLate-demographic dividendLatin America & Caribbean Latin America & Caribbean (excluding high income)Latin America & the Caribbean (IDA & IBRD countries)LatviaLebanonLithuaniaLow & middle incomeLower middle incomeLuxembourgMacedonia, FYRMalawiMalaysiaMaltaMauritiusMexicoMiddle East & North AfricaMiddle East & North Africa (excluding high income)Middle East & North Africa (IDA & IBRD countries)Middle incomeMoldovaMongoliaMontenegroMoroccoNamibiaNetherlandsNew ZealandNigeriaNorth AmericaNorwayOECD membersOmanOther small statesPakistanPanamaPapua New GuineaParaguayPeruPhilippinesPolandPortugalPost-demographic dividendQatarRomaniaRussian FederationSaudi ArabiaSerbiaSeychellesSingaporeSlovak RepublicSloveniaSouth AfricaSouth AsiaSouth Asia (IDA & IBRD)SpainSri LankaSt. Kitts and NevisSub-Saharan Africa Sub-Saharan Africa (excluding high income)Sub-Saharan Africa (IDA & IBRD countries)SwazilandSwedenSwitzerlandTanzaniaThailandTrinidad and TobagoTunisiaTurkeyUgandaUkraineUnited Arab EmiratesUnited KingdomUnited StatesUpper middle incomeUruguayUzbekistanVenezuela, RBVietnamWest Bank and GazaWorldZambiaZimbabwe

La ligne de temps

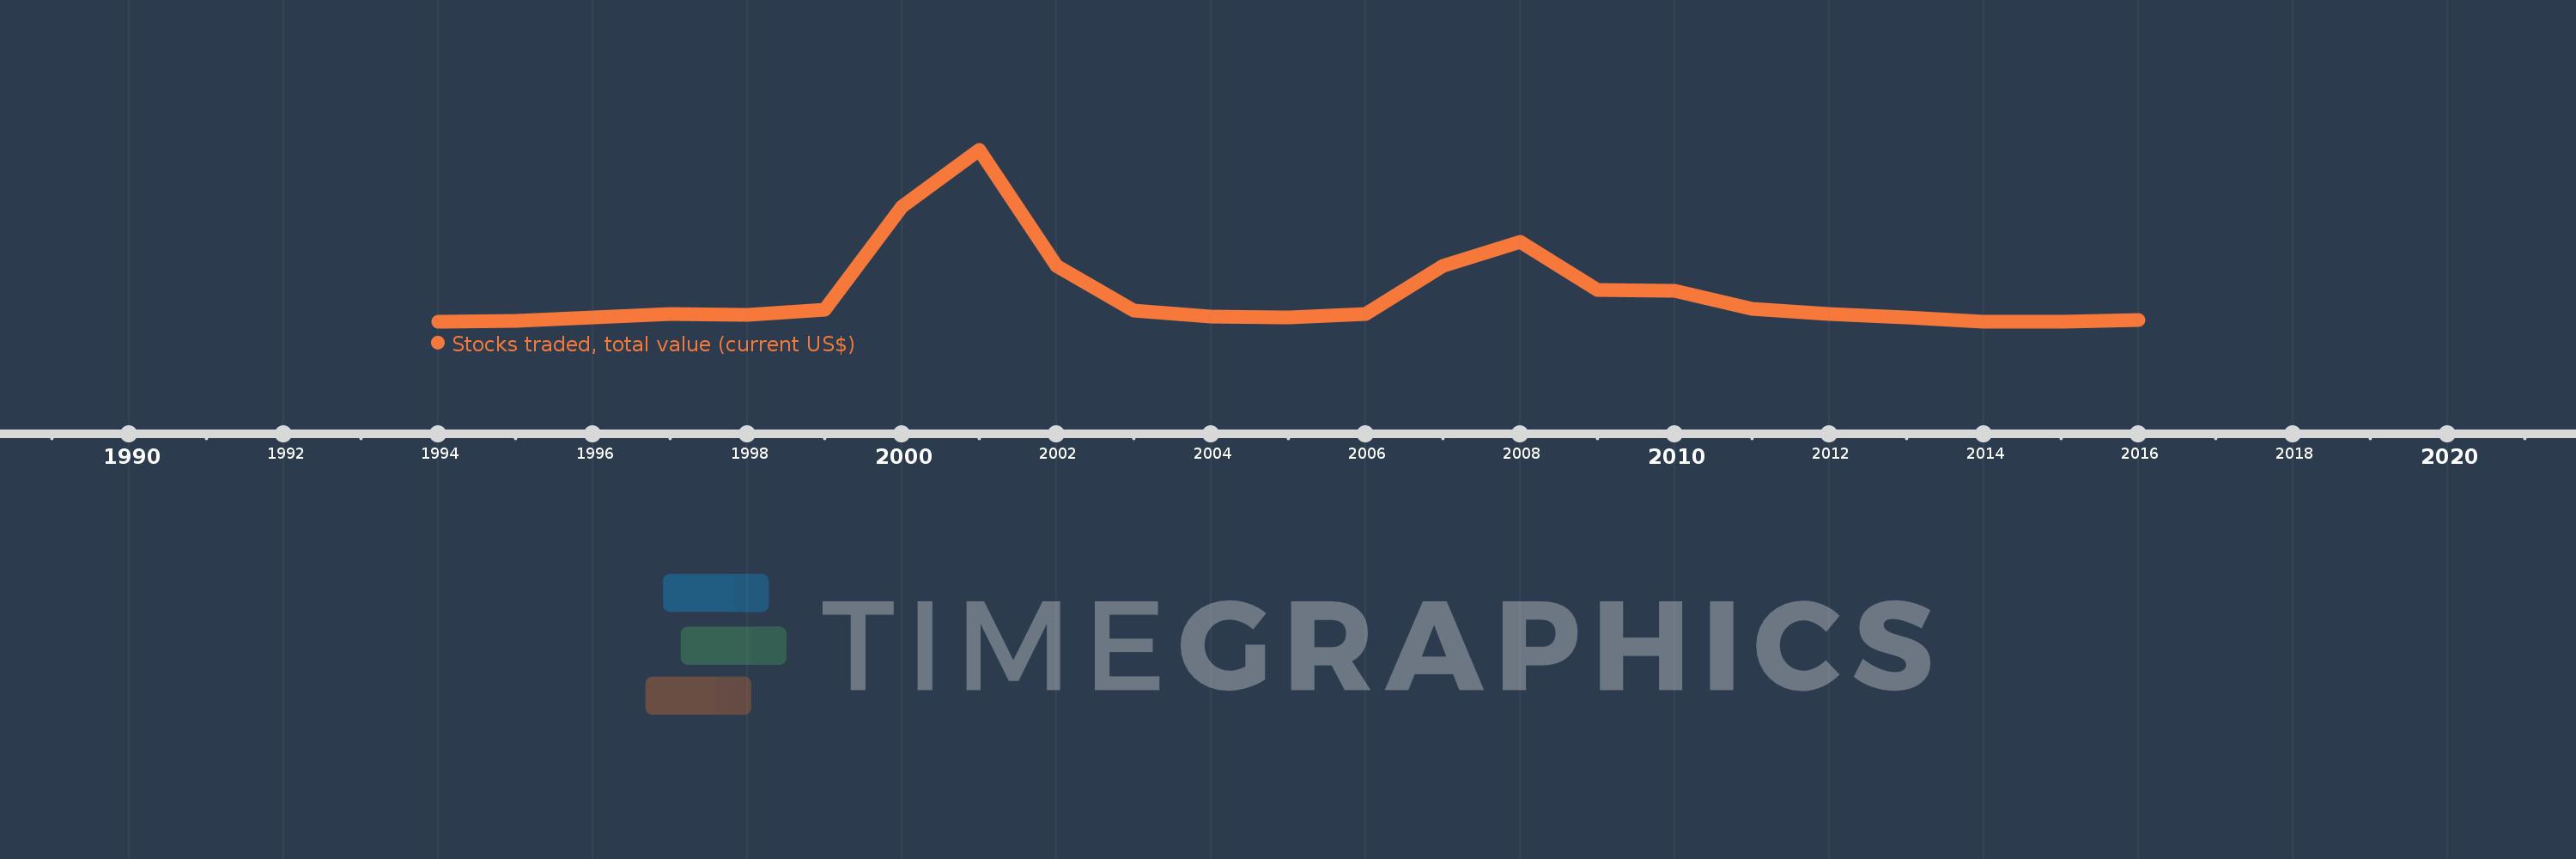
Cette échelle de temps montre un graphique de 1994 année à 2016 année Cyprus. Les données jusqu'à 1993 année ne sont pas présentés. Quantité d'observations actuelles selon dates: 23.

Source (désignation):

Les indicateurs du développement mondiale

Source (organisation):

World Federation of Exchanges database.

Catégories:

Financial Sector

Dernière mise à jour

23 avr. 2017

Les indicateurs de changement de valeurs selon les années

En moyenne:
1.551 mds
Minimum:
28.1 mln.
1 janv. 1994
Maximum:
9.541 mds
1 janv. 2001
Pour la date d''observation
Valeur
Changement absolu
Le changement par rapport à la valeur précédente
1 janv. 1994
28.1 mln.
+28.1 mln.
0.0%
1 janv. 1995
88.2 mln.
+60.1 mln.
213.88%
1 janv. 1996
296.7 mln.
+208.5 mln.
236.39%
1 janv. 1997
458.5 mln.
+161.8 mln.
54.53%
1 janv. 1998
402.5 mln.
-56.0 mln.
-12.21%
1 janv. 1999
700.3 mln.
+297.8 mln.
73.99%
1 janv. 2000
6.409 mds
+5.709 mds
815.18%
1 janv. 2001
9.541 mds
+3.132 mds
48.87%
1 janv. 2002
3.149 mds
-6.393 mds
-67.0%
1 janv. 2003
668.0 mln.
-2.481 mds
-78.79%
1 janv. 2004
310.3 mln.
-357.7 mln.
-53.55%
1 janv. 2005
264.7 mln.
-45.6 mln.
-14.7%
1 janv. 2006
472.8 mln.
+208.1 mln.
78.62%
1 janv. 2007
3.147 mds
+2.674 mds
565.5%
1 janv. 2008
4.465 mds
+1.318 mds
41.89%
1 janv. 2009
1.794 mds
-2.67 mds
-59.81%
1 janv. 2010
1.761 mds
-33.12 mln.
-1.85%
1 janv. 2011
742.5 mln.
-1.019 mds
-57.84%
1 janv. 2012
449.2 mln.
-293.3 mln.
-39.5%
1 janv. 2013
294.61 mln.
-154.59 mln.
-34.41%
1 janv. 2014
41.22 mln.
-253.39 mln.
-86.01%
1 janv. 2015
56.61 mln.
+15.39 mln.
37.34%
1 janv. 2016
130.9 mln.
+74.29 mln.
131.23%

Classement des pays selon les statistiques actuelles par années