30
/fr/
AIzaSyAYiBZKx7MnpbEhh9jyipgxe19OcubqV5w
April 1, 2024
177117
Lebanon
LBN
true
2
1
Stocks traded, total value (current US$)
2015,2014,2013,2012,2011,2010,2009,2008,2007,2006,2005,2004,2003,2002,2001,2000,1999,1998,1997
Download
Bibliothèque de statistiques globales →Lebanon →

Stocks traded, total value (current US$)

Cette statistique dans les autres pays:

Arab WorldArgentinaArmeniaAustraliaAustriaBahrainBangladeshBarbadosBelgiumBermudaBoliviaBotswanaBrazilBulgariaCanadaCayman IslandsCentral Europe and the BalticsChannel IslandsChileChinaColombiaCosta RicaCote d'IvoireCroatiaCyprusCzech RepublicDenmarkEarly-demographic dividendEast Asia & PacificEast Asia & Pacific (excluding high income)East Asia & Pacific (IDA & IBRD countries)EcuadorEgypt, Arab Rep.El SalvadorEstoniaEuro areaEurope & Central AsiaEurope & Central Asia (excluding high income)Europe & Central Asia (IDA & IBRD countries)European UnionFijiFinlandFranceGeorgiaGermanyGhanaGreeceGuyanaHigh incomeHong Kong SAR, ChinaHungaryIBRD onlyIcelandIDA & IBRD totalIDA blendIDA totalIndiaIndonesiaIran, Islamic Rep.IrelandIsraelItalyJamaicaJapanJordanKazakhstanKenyaKorea, Rep.KuwaitKyrgyz RepublicLate-demographic dividendLatin America & Caribbean Latin America & Caribbean (excluding high income)Latin America & the Caribbean (IDA & IBRD countries)LatviaLebanonLithuaniaLow & middle incomeLower middle incomeLuxembourgMacedonia, FYRMalawiMalaysiaMaltaMauritiusMexicoMiddle East & North AfricaMiddle East & North Africa (excluding high income)Middle East & North Africa (IDA & IBRD countries)Middle incomeMoldovaMongoliaMontenegroMoroccoNamibiaNetherlandsNew ZealandNigeriaNorth AmericaNorwayOECD membersOmanOther small statesPakistanPanamaPapua New GuineaParaguayPeruPhilippinesPolandPortugalPost-demographic dividendQatarRomaniaRussian FederationSaudi ArabiaSerbiaSeychellesSingaporeSlovak RepublicSloveniaSouth AfricaSouth AsiaSouth Asia (IDA & IBRD)SpainSri LankaSt. Kitts and NevisSub-Saharan Africa Sub-Saharan Africa (excluding high income)Sub-Saharan Africa (IDA & IBRD countries)SwazilandSwedenSwitzerlandTanzaniaThailandTrinidad and TobagoTunisiaTurkeyUgandaUkraineUnited Arab EmiratesUnited KingdomUnited StatesUpper middle incomeUruguayUzbekistanVenezuela, RBVietnamWest Bank and GazaWorldZambiaZimbabwe

La ligne de temps

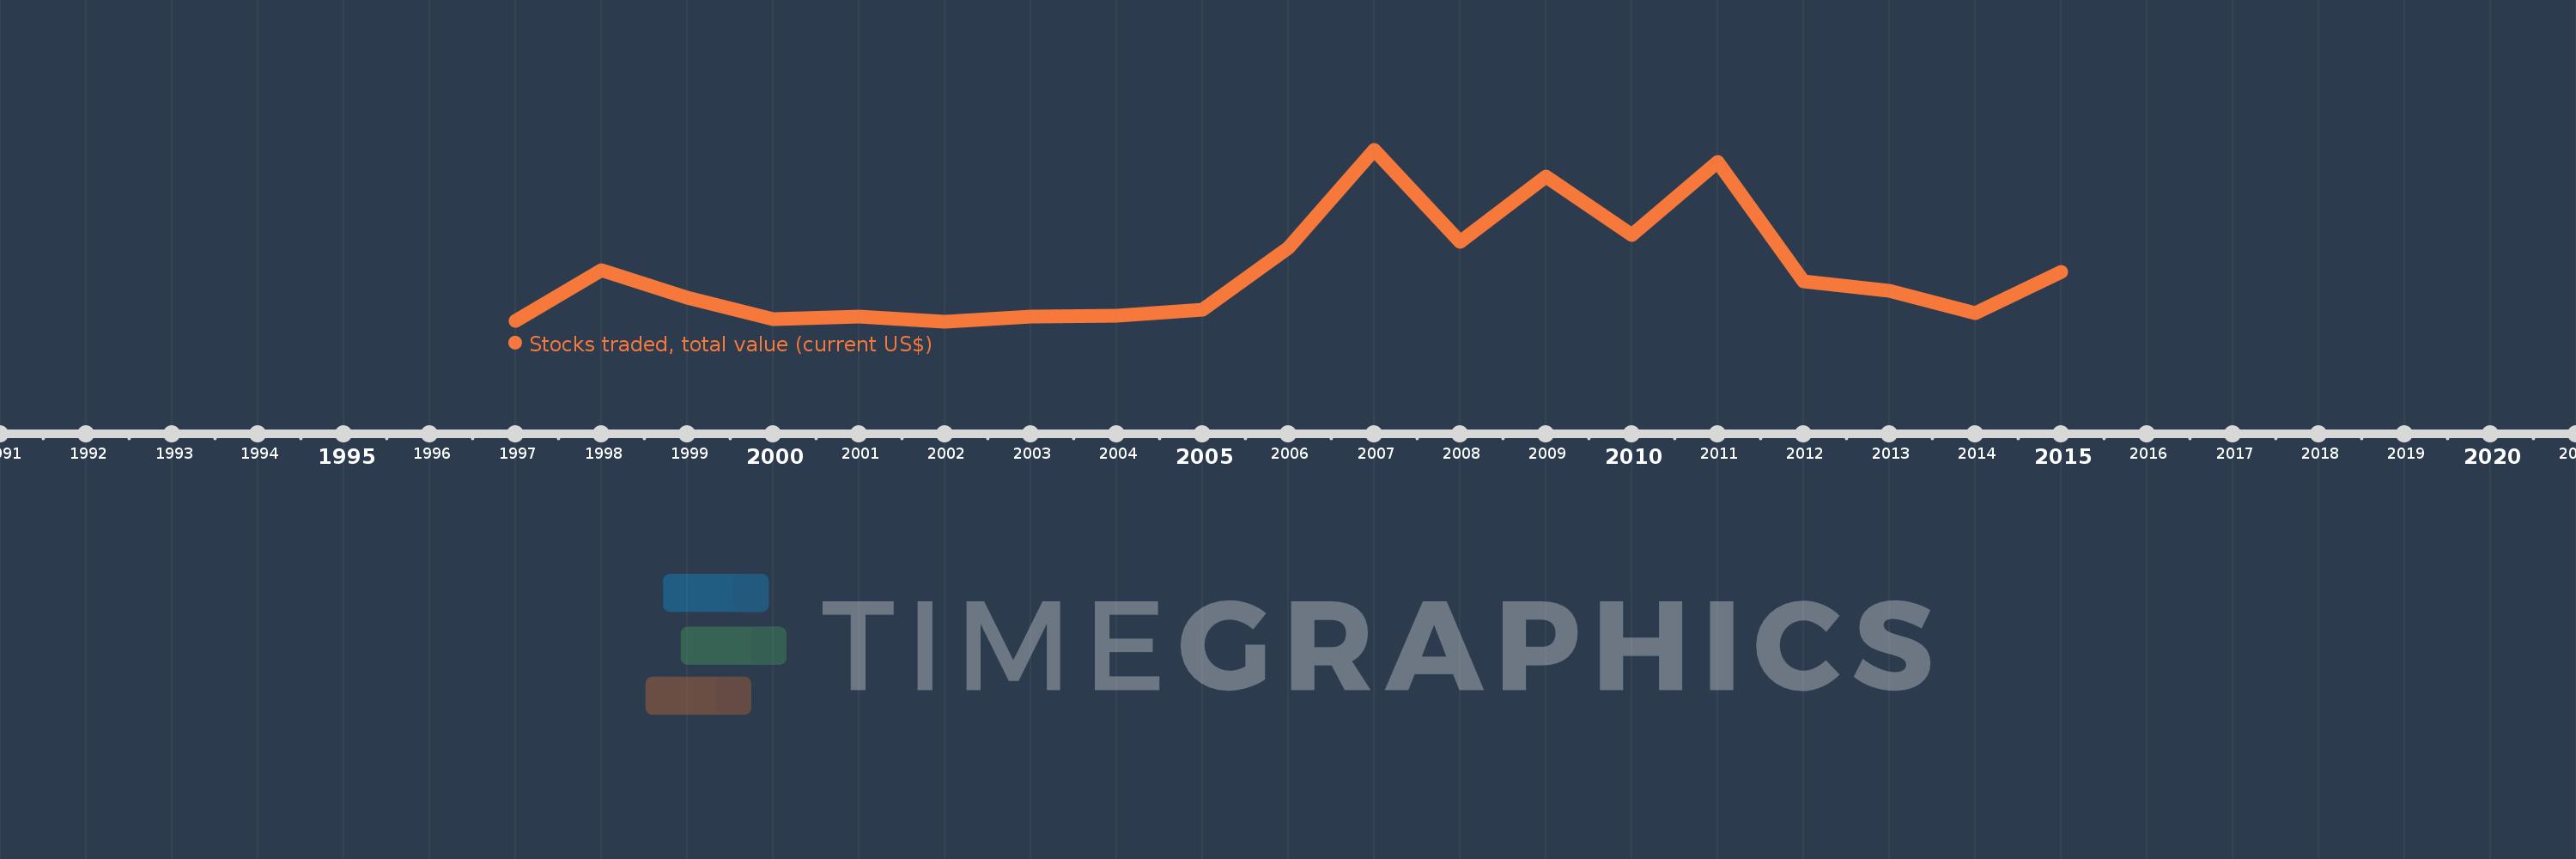
Cette échelle de temps montre un graphique de 1997 année à 2015 année Lebanon. Les données jusqu'à 1996 année ne sont pas présentés. Quantité d'observations actuelles selon dates: 19.

Source (désignation):

Les indicateurs du développement mondiale

Source (organisation):

World Federation of Exchanges database.

Catégories:

Financial Sector

Dernière mise à jour

23 avr. 2017

Les indicateurs de changement de valeurs selon les années

En moyenne:
627.924 mln.
Minimum:
52.6 mln.
1 janv. 2002
Maximum:
2.011 mds
1 janv. 2007
Pour la date d''observation
Valeur
Changement absolu
Le changement par rapport à la valeur précédente
1 janv. 1997
67.09 mln.
+67.09 mln.
0.0%
1 janv. 1998
639.73 mln.
+572.64 mln.
853.54%
1 janv. 1999
328.35 mln.
-311.38 mln.
-48.67%
1 janv. 2000
86.2 mln.
-242.15 mln.
-73.75%
1 janv. 2001
116.36 mln.
+30.16 mln.
34.99%
1 janv. 2002
52.6 mln.
-63.76 mln.
-54.8%
1 janv. 2003
117.66 mln.
+65.06 mln.
123.69%
1 janv. 2004
124.01 mln.
+6.35 mln.
5.4%
1 janv. 2005
188.23 mln.
+64.22 mln.
51.79%
1 janv. 2006
902.1 mln.
+713.87 mln.
379.25%
1 janv. 2007
2.011 mds
+1.108 mds
122.88%
1 janv. 2008
967.4 mln.
-1.043 mds
-51.88%
1 janv. 2009
1.711 mds
+743.88 mln.
76.89%
1 janv. 2010
1.041 mds
-670.36 mln.
-39.17%
1 janv. 2011
1.877 mds
+836.34 mln.
80.35%
1 janv. 2012
511.49 mln.
-1.366 mds
-72.75%
1 janv. 2013
408.0 mln.
-103.49 mln.
-20.23%
1 janv. 2014
156.9 mln.
-251.1 mln.
-61.54%
1 janv. 2015
624.4 mln.
+467.5 mln.
297.96%

Classement des pays selon les statistiques actuelles par années