30
/fr/
AIzaSyAYiBZKx7MnpbEhh9jyipgxe19OcubqV5w
April 1, 2024
114322
Cote d'Ivoire
CIV
true
2
1
Stocks traded, total value (current US$)
2016,2015,2014,2013,2012,2011,2010,2009,2008,2007,2006,2005,2004,2003,2002,2001,2000,1999,1997,1996,1995,1994
Download
Bibliothèque de statistiques globales →Cote d'Ivoire →

Stocks traded, total value (current US$)

Cette statistique dans les autres pays:

Arab WorldArgentinaArmeniaAustraliaAustriaBahrainBangladeshBarbadosBelgiumBermudaBoliviaBotswanaBrazilBulgariaCanadaCayman IslandsCentral Europe and the BalticsChannel IslandsChileChinaColombiaCosta RicaCote d'IvoireCroatiaCyprusCzech RepublicDenmarkEarly-demographic dividendEast Asia & PacificEast Asia & Pacific (excluding high income)East Asia & Pacific (IDA & IBRD countries)EcuadorEgypt, Arab Rep.El SalvadorEstoniaEuro areaEurope & Central AsiaEurope & Central Asia (excluding high income)Europe & Central Asia (IDA & IBRD countries)European UnionFijiFinlandFranceGeorgiaGermanyGhanaGreeceGuyanaHigh incomeHong Kong SAR, ChinaHungaryIBRD onlyIcelandIDA & IBRD totalIDA blendIDA totalIndiaIndonesiaIran, Islamic Rep.IrelandIsraelItalyJamaicaJapanJordanKazakhstanKenyaKorea, Rep.KuwaitKyrgyz RepublicLate-demographic dividendLatin America & Caribbean Latin America & Caribbean (excluding high income)Latin America & the Caribbean (IDA & IBRD countries)LatviaLebanonLithuaniaLow & middle incomeLower middle incomeLuxembourgMacedonia, FYRMalawiMalaysiaMaltaMauritiusMexicoMiddle East & North AfricaMiddle East & North Africa (excluding high income)Middle East & North Africa (IDA & IBRD countries)Middle incomeMoldovaMongoliaMontenegroMoroccoNamibiaNetherlandsNew ZealandNigeriaNorth AmericaNorwayOECD membersOmanOther small statesPakistanPanamaPapua New GuineaParaguayPeruPhilippinesPolandPortugalPost-demographic dividendQatarRomaniaRussian FederationSaudi ArabiaSerbiaSeychellesSingaporeSlovak RepublicSloveniaSouth AfricaSouth AsiaSouth Asia (IDA & IBRD)SpainSri LankaSt. Kitts and NevisSub-Saharan Africa Sub-Saharan Africa (excluding high income)Sub-Saharan Africa (IDA & IBRD countries)SwazilandSwedenSwitzerlandTanzaniaThailandTrinidad and TobagoTunisiaTurkeyUgandaUkraineUnited Arab EmiratesUnited KingdomUnited StatesUpper middle incomeUruguayUzbekistanVenezuela, RBVietnamWest Bank and GazaWorldZambiaZimbabwe

La ligne de temps

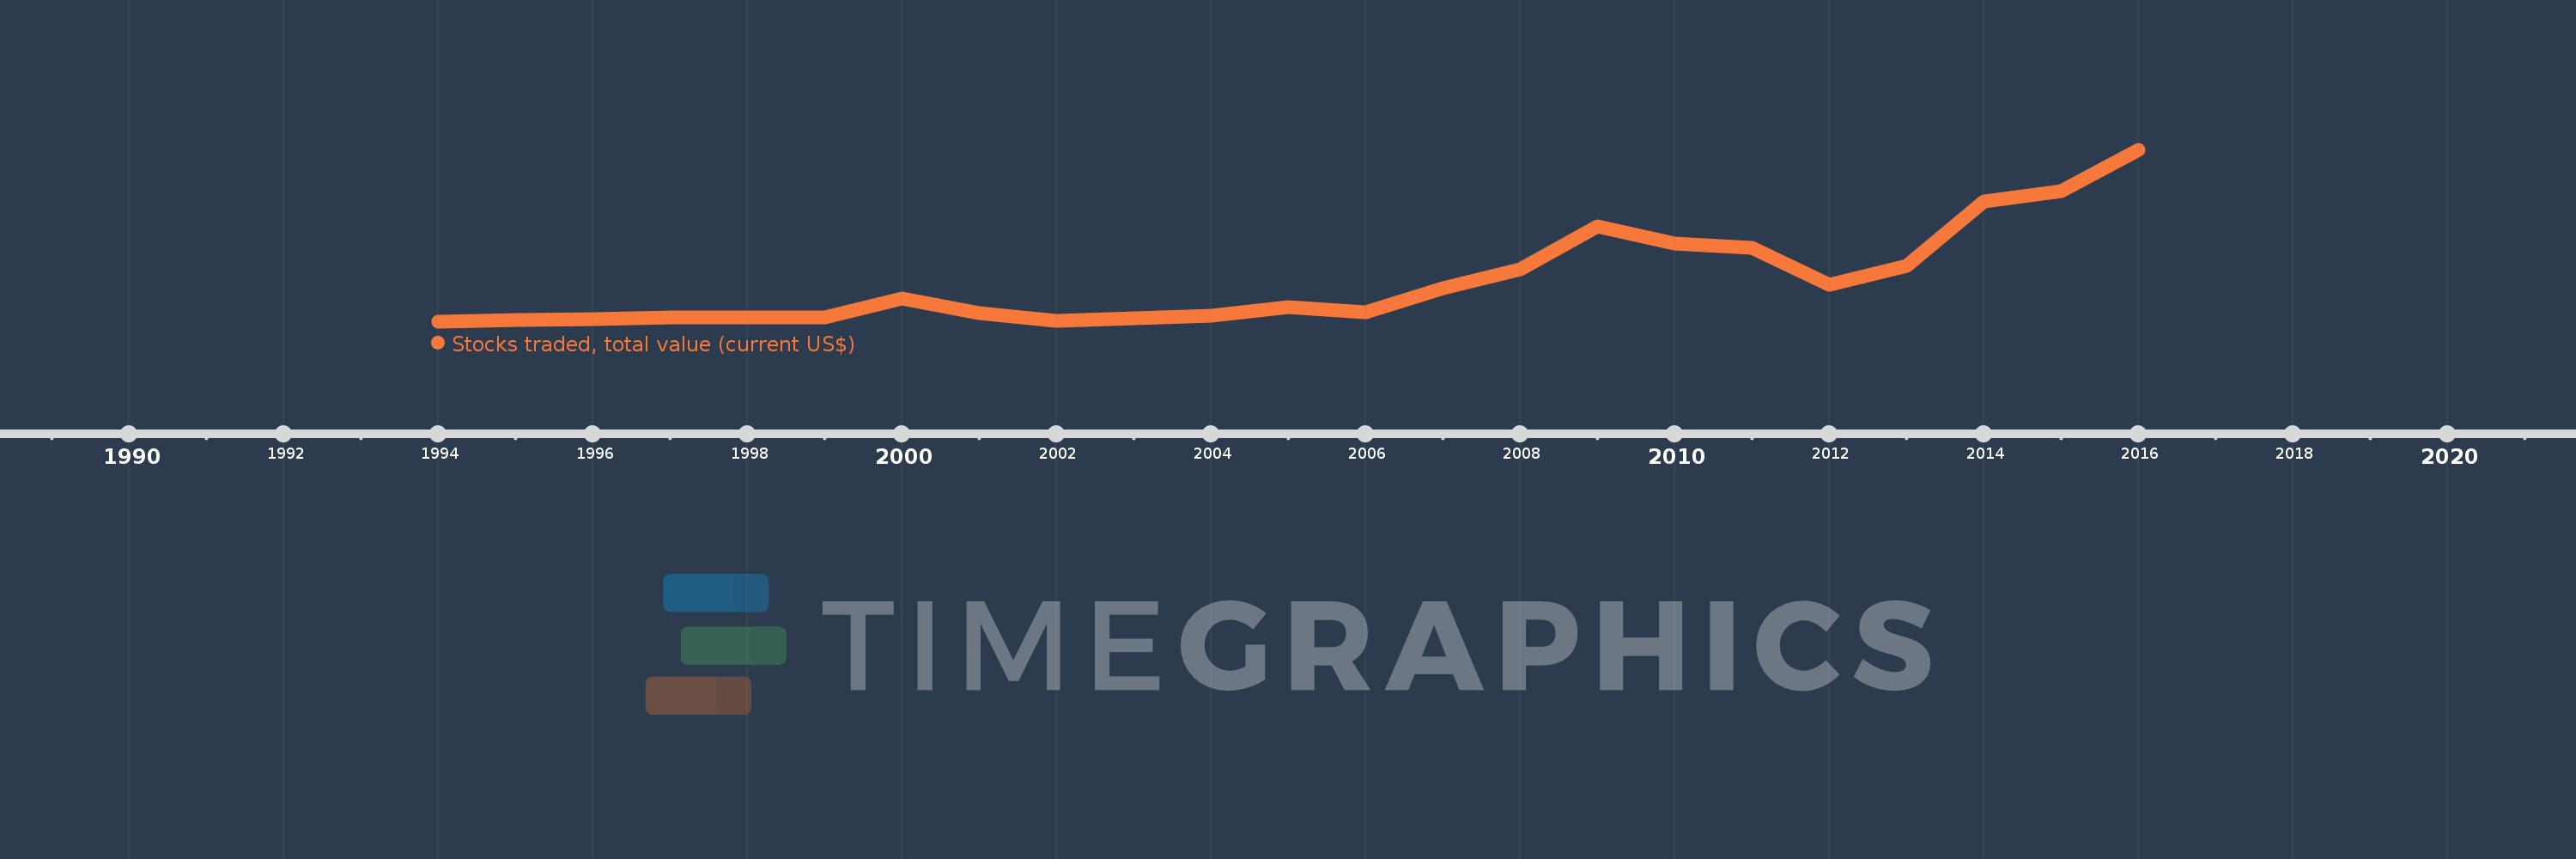
Cette échelle de temps montre un graphique de 1994 année à 2016 année Cote d'Ivoire. Les données jusqu'à 1993 année ne sont pas présentés. Quantité d'observations actuelles selon dates: 22.

Source (désignation):

Les indicateurs du développement mondiale

Source (organisation):

World Federation of Exchanges database.

Catégories:

Financial Sector

Dernière mise à jour

23 avr. 2017

Les indicateurs de changement de valeurs selon les années

En moyenne:
132.845 mln.
Minimum:
5.2 mln.
1 janv. 1994
Maximum:
521.85 mln.
1 janv. 2016
Pour la date d''observation
Valeur
Changement absolu
Le changement par rapport à la valeur précédente
1 janv. 1994
5.2 mln.
+5.2 mln.
0.0%
1 janv. 1995
11.5 mln.
+6.3 mln.
121.15%
1 janv. 1996
14.1 mln.
+2.6 mln.
22.61%
1 janv. 1997
18.97 mln.
+4.87 mln.
34.54%
1 janv. 1999
19.02 mln.
+50.0 milles
0.26%
1 janv. 2000
75.42 mln.
+56.4 mln.
296.53%
1 janv. 2001
32.99 mln.
-42.43 mln.
-56.26%
1 janv. 2002
8.6 mln.
-24.39 mln.
-73.93%
1 janv. 2003
17.49 mln.
+8.89 mln.
103.37%
1 janv. 2004
24.31 mln.
+6.82 mln.
38.99%
1 janv. 2005
50.17 mln.
+25.86 mln.
106.38%
1 janv. 2006
34.96 mln.
-15.21 mln.
-30.32%
1 janv. 2007
107.04 mln.
+72.08 mln.
206.18%
1 janv. 2008
164.36 mln.
+57.32 mln.
53.55%
1 janv. 2009
291.86 mln.
+127.5 mln.
77.57%
1 janv. 2010
240.6 mln.
-51.26 mln.
-17.56%
1 janv. 2011
227.01 mln.
-13.59 mln.
-5.65%
1 janv. 2012
116.58 mln.
-110.43 mln.
-48.65%
1 janv. 2013
174.2 mln.
+57.62 mln.
49.43%
1 janv. 2014
367.37 mln.
+193.17 mln.
110.89%
1 janv. 2015
398.98 mln.
+31.61 mln.
8.6%
1 janv. 2016
521.85 mln.
+122.87 mln.
30.8%

Classement des pays selon les statistiques actuelles par années