30
/fr/
AIzaSyAYiBZKx7MnpbEhh9jyipgxe19OcubqV5w
April 1, 2024
138782
Georgia
GEO
true
2
1
Stocks traded, total value (current US$)
2013,2012,2011,2010,2009,2008,2007,2006,2005,2004,2003,2002,2001
Download
Bibliothèque de statistiques globales →Georgia →

Stocks traded, total value (current US$)

Cette statistique dans les autres pays:

Arab WorldArgentinaArmeniaAustraliaAustriaBahrainBangladeshBarbadosBelgiumBermudaBoliviaBotswanaBrazilBulgariaCanadaCayman IslandsCentral Europe and the BalticsChannel IslandsChileChinaColombiaCosta RicaCote d'IvoireCroatiaCyprusCzech RepublicDenmarkEarly-demographic dividendEast Asia & PacificEast Asia & Pacific (excluding high income)East Asia & Pacific (IDA & IBRD countries)EcuadorEgypt, Arab Rep.El SalvadorEstoniaEuro areaEurope & Central AsiaEurope & Central Asia (excluding high income)Europe & Central Asia (IDA & IBRD countries)European UnionFijiFinlandFranceGeorgiaGermanyGhanaGreeceGuyanaHigh incomeHong Kong SAR, ChinaHungaryIBRD onlyIcelandIDA & IBRD totalIDA blendIDA totalIndiaIndonesiaIran, Islamic Rep.IrelandIsraelItalyJamaicaJapanJordanKazakhstanKenyaKorea, Rep.KuwaitKyrgyz RepublicLate-demographic dividendLatin America & Caribbean Latin America & Caribbean (excluding high income)Latin America & the Caribbean (IDA & IBRD countries)LatviaLebanonLithuaniaLow & middle incomeLower middle incomeLuxembourgMacedonia, FYRMalawiMalaysiaMaltaMauritiusMexicoMiddle East & North AfricaMiddle East & North Africa (excluding high income)Middle East & North Africa (IDA & IBRD countries)Middle incomeMoldovaMongoliaMontenegroMoroccoNamibiaNetherlandsNew ZealandNigeriaNorth AmericaNorwayOECD membersOmanOther small statesPakistanPanamaPapua New GuineaParaguayPeruPhilippinesPolandPortugalPost-demographic dividendQatarRomaniaRussian FederationSaudi ArabiaSerbiaSeychellesSingaporeSlovak RepublicSloveniaSouth AfricaSouth AsiaSouth Asia (IDA & IBRD)SpainSri LankaSt. Kitts and NevisSub-Saharan Africa Sub-Saharan Africa (excluding high income)Sub-Saharan Africa (IDA & IBRD countries)SwazilandSwedenSwitzerlandTanzaniaThailandTrinidad and TobagoTunisiaTurkeyUgandaUkraineUnited Arab EmiratesUnited KingdomUnited StatesUpper middle incomeUruguayUzbekistanVenezuela, RBVietnamWest Bank and GazaWorldZambiaZimbabwe

La ligne de temps

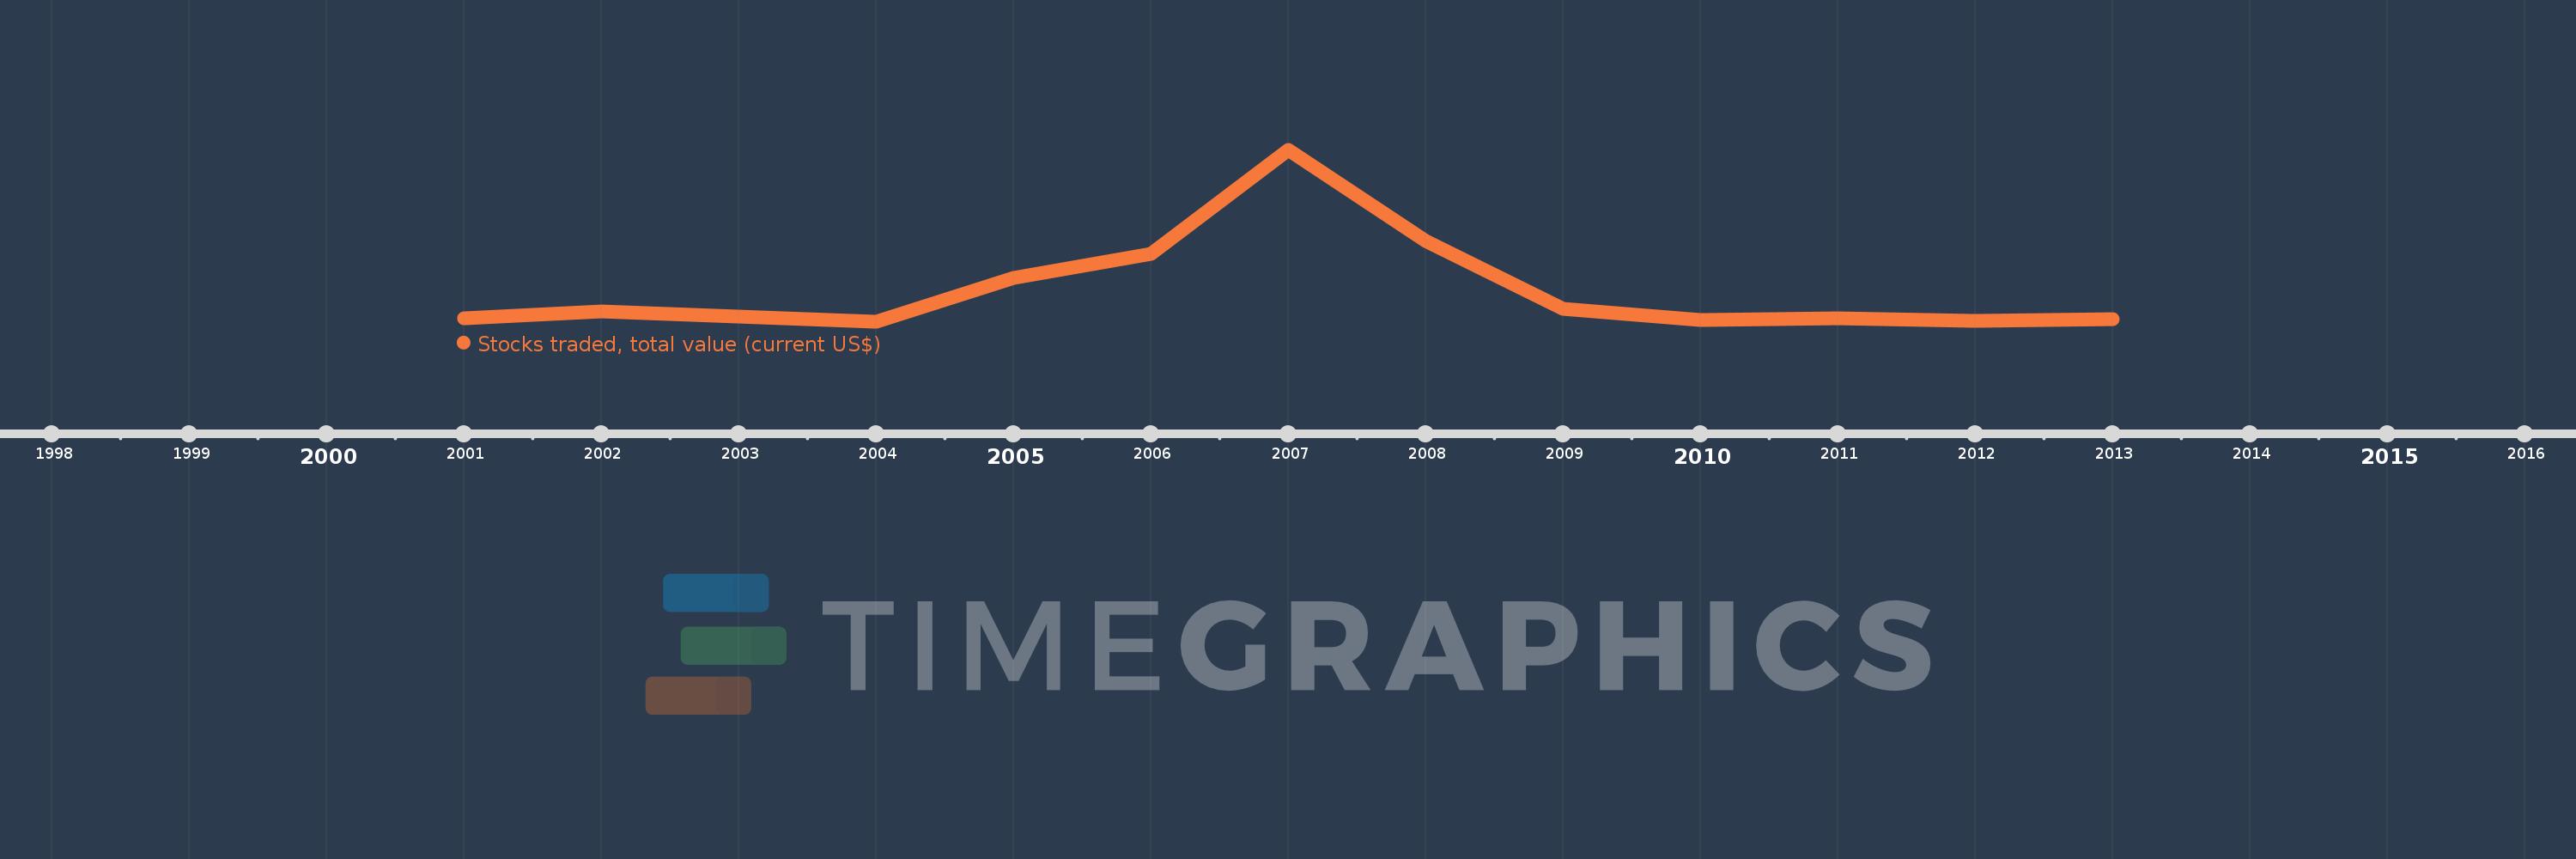
Cette échelle de temps montre un graphique de 2001 année à 2013 année Georgia. Les données jusqu'à 2000 année ne sont pas présentés. Quantité d'observations actuelles selon dates: 13.

Source (désignation):

Les indicateurs du développement mondiale

Source (organisation):

World Federation of Exchanges database.

Catégories:

Financial Sector

Dernière mise à jour

23 avr. 2017

Les indicateurs de changement de valeurs selon les années

En moyenne:
18.002 mln.
Minimum:
800.0 milles
1 janv. 2004
Maximum:
95.162 mln.
1 janv. 2007
Pour la date d''observation
Valeur
Changement absolu
Le changement par rapport à la valeur précédente
1 janv. 2001
3.0 mln.
+3.0 mln.
0.0%
1 janv. 2002
6.4 mln.
+3.4 mln.
113.33%
1 janv. 2003
3.8 mln.
-2.6 mln.
-40.63%
1 janv. 2004
800.0 milles
-3.0 mln.
-78.95%
1 janv. 2005
25.0 mln.
+24.2 mln.
3.02 milles%
1 janv. 2006
38.03 mln.
+13.03 mln.
52.12%
1 janv. 2007
95.162 mln.
+57.132 mln.
150.23%
1 janv. 2008
45.212 mln.
-49.949 mln.
-52.49%
1 janv. 2009
8.246 mln.
-36.966 mln.
-81.76%
1 janv. 2010
1.855 mln.
-6.391 mln.
-77.5%
1 janv. 2011
2.88 mln.
+1.024 mln.
55.21%
1 janv. 2012
1.476 mln.
-1.403 mln.
-48.73%
1 janv. 2013
2.165 mln.
+688.254 milles
46.61%

Classement des pays selon les statistiques actuelles par années