29
/es/
es
AIzaSyAYiBZKx7MnpbEhh9jyipgxe19OcubqV5w
April 1, 2024
98329
Cambodia
KHM
true
2
1
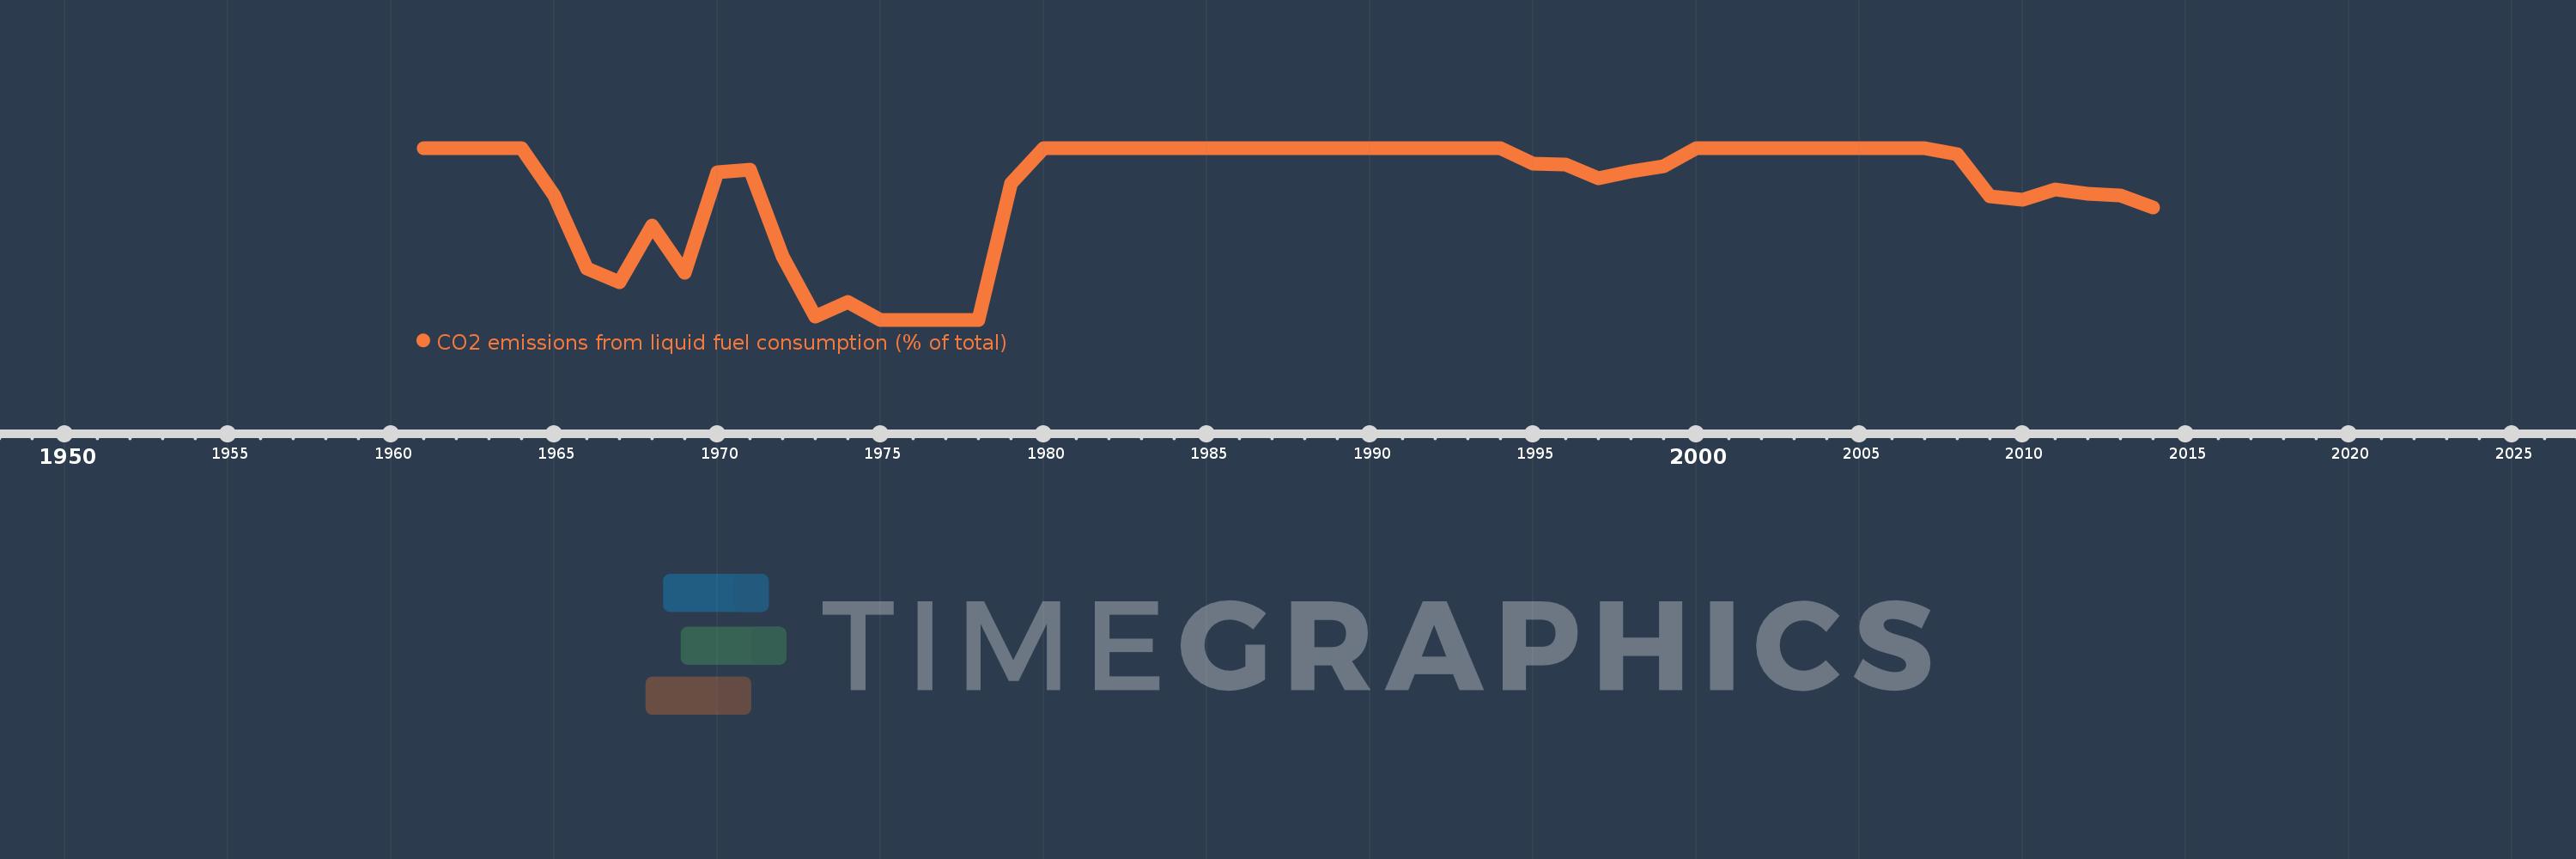
CO2 emissions from liquid fuel consumption (% of total)
2014,2013,2012,2011,2010,2009,2008,2007,2006,2005,2004,2003,2002,2001,2000,1999,1998,1997,1996,1995,1994,1993,1992,1991,1990,1989,1988,1987,1986,1985,1984,1983,1982,1981,1980,1979,1978,1977,1976,1975,1974,1973,1972,1971,1970,1969,1968,1967,1966,1965,1964,1963,1962,1961
Estas estadísticas en otros países:
AfghanistanAlbaniaAlgeriaAndorraAngolaAntigua and BarbudaArab WorldArgentinaArmeniaArubaAustraliaAustriaAzerbaijanBahamas, TheBahrainBangladeshBarbadosBelarusBelgiumBelizeBeninBermudaBhutanBoliviaBosnia and HerzegovinaBotswanaBrazilBritish Virgin IslandsBrunei DarussalamBulgariaBurkina FasoBurundiCabo VerdeCambodiaCameroonCanadaCaribbean small statesCayman IslandsCentral African RepublicCentral Europe and the BalticsChadChileChinaColombiaComorosCongo, Dem. Rep.Congo, Rep.Costa RicaCote d'IvoireCroatiaCubaCuracaoCyprusCzech RepublicDenmarkDjiboutiDominicaDominican RepublicEarly-demographic dividendEast Asia & PacificEast Asia & Pacific (excluding high income)East Asia & Pacific (IDA & IBRD countries)EcuadorEgypt, Arab Rep.El SalvadorEquatorial GuineaEritreaEstoniaEthiopiaEuro areaEurope & Central AsiaEurope & Central Asia (excluding high income)Europe & Central Asia (IDA & IBRD countries)European UnionFaroe IslandsFijiFinlandFragile and conflict affected situationsFranceFrench PolynesiaGabonGambia, TheGeorgiaGermanyGhanaGibraltarGreeceGreenlandGrenadaGuatemalaGuineaGuinea-BissauGuyanaHaitiHeavily indebted poor countries (HIPC)High incomeHondurasHong Kong SAR, ChinaHungaryIBRD onlyIcelandIDA & IBRD totalIDA blendIDA onlyIDA totalIndiaIndonesiaIran, Islamic Rep.IraqIrelandIsraelItalyJamaicaJapanJordanKazakhstanKenyaKiribatiKorea, Dem. People’s Rep.Korea, Rep.KuwaitKyrgyz RepublicLao PDRLate-demographic dividendLatin America & Caribbean Latin America & Caribbean (excluding high income)Latin America & the Caribbean (IDA & IBRD countries)LatviaLeast developed countries: UN classificationLebanonLesothoLiberiaLibyaLiechtensteinLithuaniaLow & middle incomeLow incomeLower middle incomeLuxembourgMacao SAR, ChinaMacedonia, FYRMadagascarMalawiMalaysiaMaldivesMaliMaltaMarshall IslandsMauritaniaMauritiusMexicoMicronesia, Fed. Sts.Middle East & North AfricaMiddle East & North Africa (excluding high income)Middle East & North Africa (IDA & IBRD countries)Middle incomeMoldovaMongoliaMontenegroMoroccoMozambiqueMyanmarNamibiaNauruNepalNetherlandsNew CaledoniaNew ZealandNicaraguaNigerNigeriaNorth AmericaNorwayOECD membersOmanOther small statesPacific island small statesPakistanPalauPanamaPapua New GuineaParaguayPeruPhilippinesPolandPortugalPost-demographic dividendPre-demographic dividendQatarRomaniaRussian FederationRwandaSamoaSao Tome and PrincipeSaudi ArabiaSenegalSerbiaSeychellesSierra LeoneSingaporeSint Maarten (Dutch part)Slovak RepublicSloveniaSmall statesSolomon IslandsSomaliaSouth AfricaSouth AsiaSouth Asia (IDA & IBRD)South SudanSpainSri LankaSt. Kitts and NevisSt. LuciaSt. Vincent and the GrenadinesSub-Saharan Africa Sub-Saharan Africa (excluding high income)Sub-Saharan Africa (IDA & IBRD countries)SudanSurinameSwazilandSwedenSwitzerlandSyrian Arab RepublicTajikistanTanzaniaThailandTimor-LesteTogoTongaTrinidad and TobagoTunisiaTurkeyTurkmenistanTurks and Caicos IslandsUgandaUkraineUnited Arab EmiratesUnited KingdomUnited StatesUpper middle incomeUruguayUzbekistanVanuatuVenezuela, RBVietnamWest Bank and GazaWorldYemen, Rep.ZambiaZimbabwe línea de tiempo (timeline):
En esta escala de tiempo se presenta un gráfico de 1961 y 2014 de Cambodia. Los datos de 1960 están ausentes. El número de observaciones reales por fecha: 54.
Fuente (nombre):
Indicadores del desarrollo mundial
Fuente (organización):
Carbon Dioxide Information Analysis Center, Environmental Sciences Division, Oak Ridge National Laboratory, Tennessee, United States.
Categorías:
Climate Change, Environment
Se ha actualizado:
23 abr 2017 año
Los indicadores de los cambios de valor en los últimos años
Mínimo:
65.0
1 ene 1975 año
Máximo:
100.0
1 ene 1961 año
A la fecha de observación
Valor
Cambio absoluto
El cambio con respecto al valor anterior
1 ene 1961 año
100.0
+100.0
0.0%
1 ene 1962 año
100.0
0.0
0.0%
1 ene 1963 año
100.0
0.0
0.0%
1 ene 1964 año
100.0
0.0
0.0%
1 ene 1965 año
90.323
-9.677
-9.68%
1 ene 1966 año
75.455
-14.868
-16.46%
1 ene 1967 año
72.656
-2.798
-3.71%
1 ene 1968 año
84.211
+11.554
15.9%
1 ene 1969 año
74.627
-9.584
-11.38%
1 ene 1970 año
95.095
+20.469
27.43%
1 ene 1971 año
95.625
+0.53
0.56%
1 ene 1972 año
77.941
-17.684
-18.49%
1 ene 1973 año
65.625
-12.316
-15.8%
1 ene 1974 año
68.571
+2.946
4.49%
1 ene 1975 año
65.0
-3.571
-5.21%
1 ene 1976 año
65.0
0.0
0.0%
1 ene 1977 año
65.0
0.0
0.0%
1 ene 1978 año
65.0
0.0
0.0%
1 ene 1979 año
92.857
+27.857
42.86%
1 ene 1980 año
100.0
+7.143
7.69%
1 ene 1981 año
100.0
0.0
0.0%
1 ene 1982 año
100.0
0.0
0.0%
1 ene 1983 año
100.0
0.0
0.0%
1 ene 1984 año
100.0
0.0
0.0%
1 ene 1985 año
100.0
0.0
0.0%
1 ene 1986 año
100.0
0.0
0.0%
1 ene 1987 año
100.0
0.0
0.0%
1 ene 1988 año
100.0
0.0
0.0%
1 ene 1989 año
100.0
0.0
0.0%
1 ene 1990 año
100.0
0.0
0.0%
1 ene 1991 año
100.0
0.0
0.0%
1 ene 1992 año
100.0
0.0
0.0%
1 ene 1993 año
100.0
0.0
0.0%
1 ene 1994 año
100.0
0.0
0.0%
1 ene 1995 año
96.804
-3.196
-3.2%
1 ene 1996 año
96.69
-0.113
-0.12%
1 ene 1997 año
93.878
-2.813
-2.91%
1 ene 1998 año
95.238
+1.361
1.45%
1 ene 1999 año
96.241
+1.003
1.05%
1 ene 2000 año
100.0
+3.759
3.91%
1 ene 2001 año
100.0
0.0
0.0%
1 ene 2002 año
100.0
0.0
0.0%
1 ene 2003 año
100.0
0.0
0.0%
1 ene 2004 año
100.0
0.0
0.0%
1 ene 2005 año
100.0
0.0
0.0%
1 ene 2006 año
100.0
0.0
0.0%
1 ene 2007 año
100.0
0.0
0.0%
1 ene 2008 año
98.73
-1.27
-1.27%
1 ene 2009 año
90.122
-8.608
-8.72%
1 ene 2010 año
89.362
-0.761
-0.84%
1 ene 2011 año
91.587
+2.226
2.49%
1 ene 2012 año
90.704
-0.883
-0.96%
1 ene 2013 año
90.323
-0.382
-0.42%
1 ene 2014 año
87.829
-2.494
-2.76%
Ranking de los países por los datos estadísticos actuales


Comentarios: