29
/es/
es
AIzaSyAYiBZKx7MnpbEhh9jyipgxe19OcubqV5w
April 1, 2024
49856
Middle East & North Africa (IDA & IBRD countries)
TMN
false
2
1
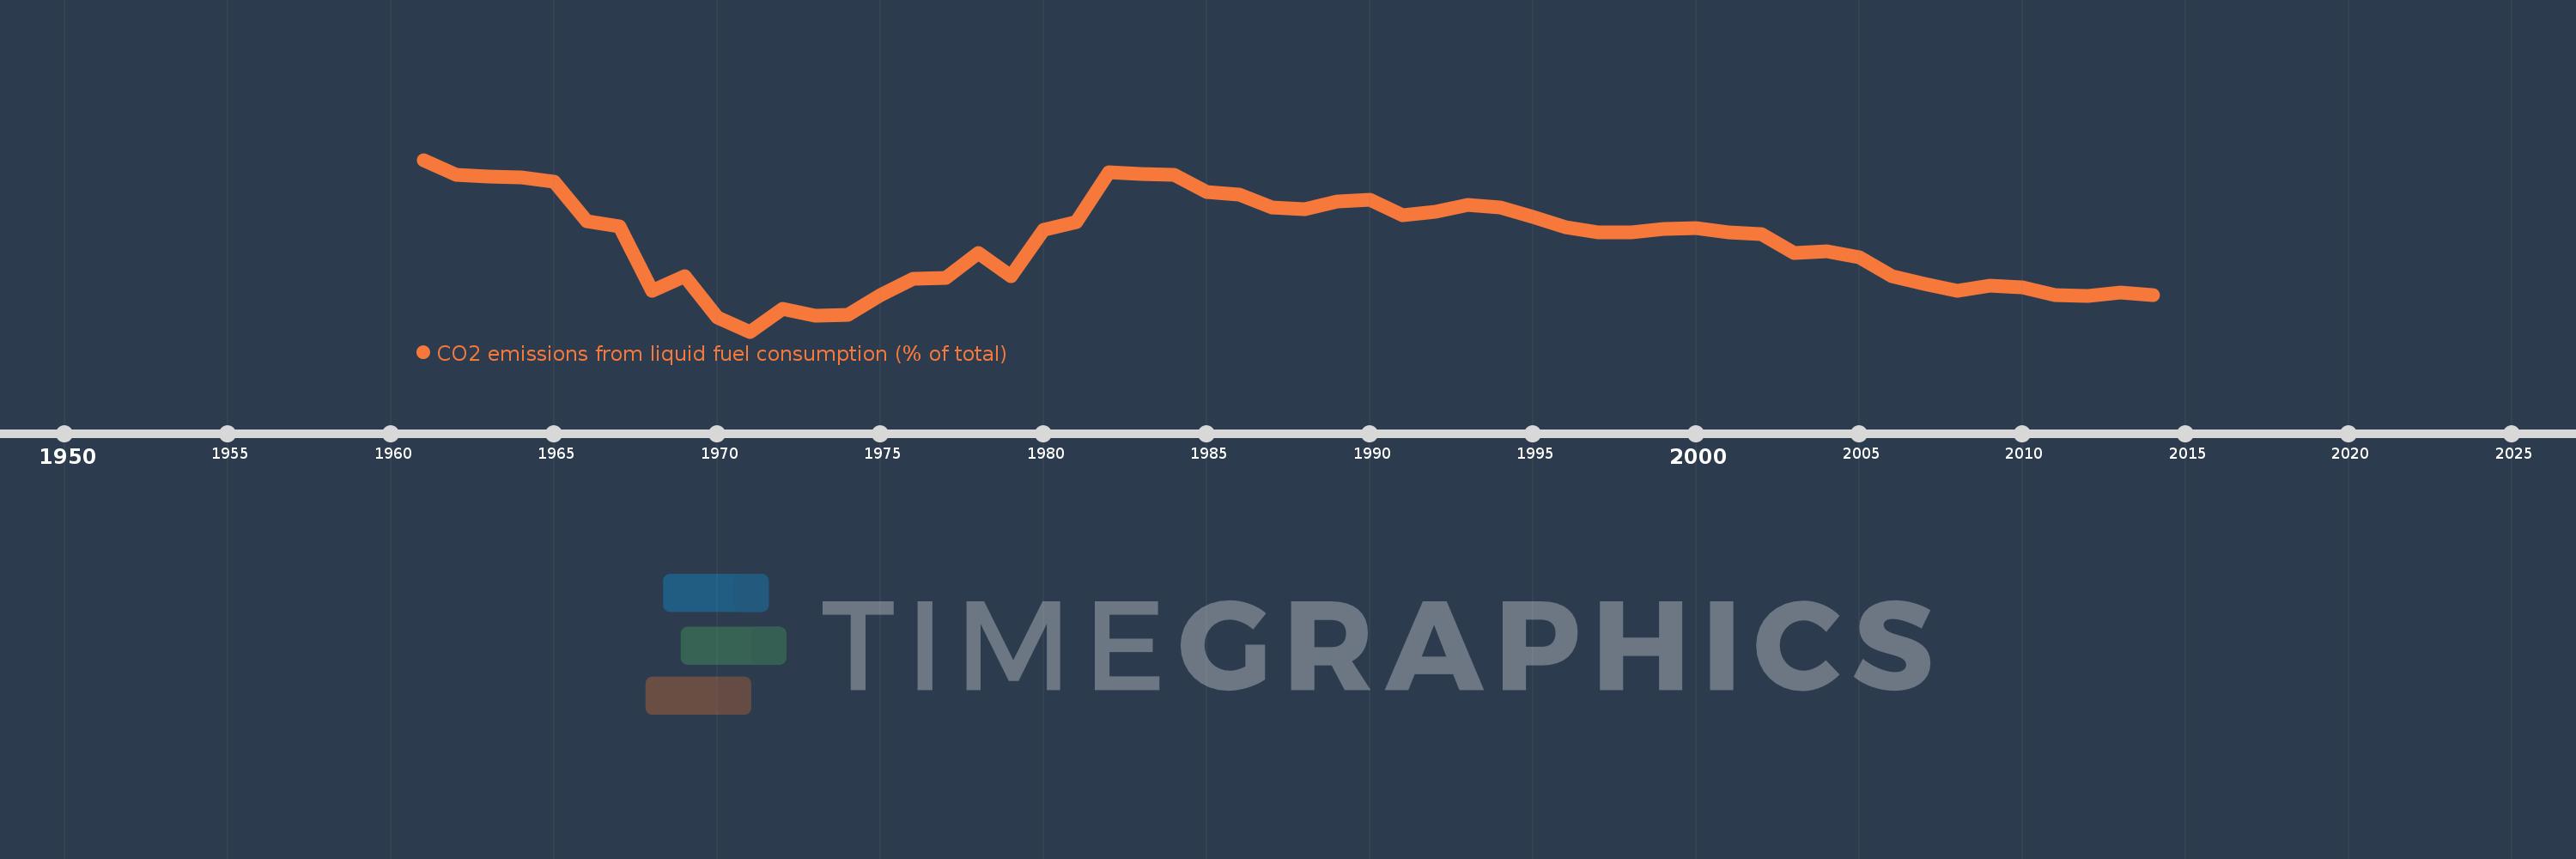
CO2 emissions from liquid fuel consumption (% of total)
2014,2013,2012,2011,2010,2009,2008,2007,2006,2005,2004,2003,2002,2001,2000,1999,1998,1997,1996,1995,1994,1993,1992,1991,1990,1989,1988,1987,1986,1985,1984,1983,1982,1981,1980,1979,1978,1977,1976,1975,1974,1973,1972,1971,1970,1969,1968,1967,1966,1965,1964,1963,1962,1961
Estas estadísticas en otros países:
AfghanistanAlbaniaAlgeriaAndorraAngolaAntigua and BarbudaArab WorldArgentinaArmeniaArubaAustraliaAustriaAzerbaijanBahamas, TheBahrainBangladeshBarbadosBelarusBelgiumBelizeBeninBermudaBhutanBoliviaBosnia and HerzegovinaBotswanaBrazilBritish Virgin IslandsBrunei DarussalamBulgariaBurkina FasoBurundiCabo VerdeCambodiaCameroonCanadaCaribbean small statesCayman IslandsCentral African RepublicCentral Europe and the BalticsChadChileChinaColombiaComorosCongo, Dem. Rep.Congo, Rep.Costa RicaCote d'IvoireCroatiaCubaCuracaoCyprusCzech RepublicDenmarkDjiboutiDominicaDominican RepublicEarly-demographic dividendEast Asia & PacificEast Asia & Pacific (excluding high income)East Asia & Pacific (IDA & IBRD countries)EcuadorEgypt, Arab Rep.El SalvadorEquatorial GuineaEritreaEstoniaEthiopiaEuro areaEurope & Central AsiaEurope & Central Asia (excluding high income)Europe & Central Asia (IDA & IBRD countries)European UnionFaroe IslandsFijiFinlandFragile and conflict affected situationsFranceFrench PolynesiaGabonGambia, TheGeorgiaGermanyGhanaGibraltarGreeceGreenlandGrenadaGuatemalaGuineaGuinea-BissauGuyanaHaitiHeavily indebted poor countries (HIPC)High incomeHondurasHong Kong SAR, ChinaHungaryIBRD onlyIcelandIDA & IBRD totalIDA blendIDA onlyIDA totalIndiaIndonesiaIran, Islamic Rep.IraqIrelandIsraelItalyJamaicaJapanJordanKazakhstanKenyaKiribatiKorea, Dem. People’s Rep.Korea, Rep.KuwaitKyrgyz RepublicLao PDRLate-demographic dividendLatin America & Caribbean Latin America & Caribbean (excluding high income)Latin America & the Caribbean (IDA & IBRD countries)LatviaLeast developed countries: UN classificationLebanonLesothoLiberiaLibyaLiechtensteinLithuaniaLow & middle incomeLow incomeLower middle incomeLuxembourgMacao SAR, ChinaMacedonia, FYRMadagascarMalawiMalaysiaMaldivesMaliMaltaMarshall IslandsMauritaniaMauritiusMexicoMicronesia, Fed. Sts.Middle East & North AfricaMiddle East & North Africa (excluding high income)Middle East & North Africa (IDA & IBRD countries)Middle incomeMoldovaMongoliaMontenegroMoroccoMozambiqueMyanmarNamibiaNauruNepalNetherlandsNew CaledoniaNew ZealandNicaraguaNigerNigeriaNorth AmericaNorwayOECD membersOmanOther small statesPacific island small statesPakistanPalauPanamaPapua New GuineaParaguayPeruPhilippinesPolandPortugalPost-demographic dividendPre-demographic dividendQatarRomaniaRussian FederationRwandaSamoaSao Tome and PrincipeSaudi ArabiaSenegalSerbiaSeychellesSierra LeoneSingaporeSint Maarten (Dutch part)Slovak RepublicSloveniaSmall statesSolomon IslandsSomaliaSouth AfricaSouth AsiaSouth Asia (IDA & IBRD)South SudanSpainSri LankaSt. Kitts and NevisSt. LuciaSt. Vincent and the GrenadinesSub-Saharan Africa Sub-Saharan Africa (excluding high income)Sub-Saharan Africa (IDA & IBRD countries)SudanSurinameSwazilandSwedenSwitzerlandSyrian Arab RepublicTajikistanTanzaniaThailandTimor-LesteTogoTongaTrinidad and TobagoTunisiaTurkeyTurkmenistanTurks and Caicos IslandsUgandaUkraineUnited Arab EmiratesUnited KingdomUnited StatesUpper middle incomeUruguayUzbekistanVanuatuVenezuela, RBVietnamWest Bank and GazaWorldYemen, Rep.ZambiaZimbabwe línea de tiempo (timeline):
En esta escala de tiempo se presenta un gráfico de 1961 y 2014 de Middle East & North Africa (IDA & IBRD countries). Los datos de 1960 están ausentes. El número de observaciones reales por fecha: 54.
Fuente (nombre):
Indicadores del desarrollo mundial
Fuente (organización):
Carbon Dioxide Information Analysis Center, Environmental Sciences Division, Oak Ridge National Laboratory, Tennessee, United States.
Categorías:
Climate Change, Environment
Se ha actualizado:
23 abr 2017 año
Los indicadores de los cambios de valor en los últimos años
Mínimo:
43.656
1 ene 1971 año
Máximo:
73.133
1 ene 1961 año
A la fecha de observación
Valor
Cambio absoluto
El cambio con respecto al valor anterior
1 ene 1961 año
73.133
+73.133
0.0%
1 ene 1962 año
70.571
-2.562
-3.5%
1 ene 1963 año
70.235
-0.336
-0.48%
1 ene 1964 año
70.086
-0.149
-0.21%
1 ene 1965 año
69.326
-0.761
-1.09%
1 ene 1966 año
62.583
-6.743
-9.73%
1 ene 1967 año
61.699
-0.883
-1.41%
1 ene 1968 año
50.628
-11.071
-17.94%
1 ene 1969 año
53.098
+2.47
4.88%
1 ene 1970 año
46.038
-7.059
-13.3%
1 ene 1971 año
43.656
-2.382
-5.17%
1 ene 1972 año
47.527
+3.87
8.87%
1 ene 1973 año
46.358
-1.169
-2.46%
1 ene 1974 año
46.571
+0.213
0.46%
1 ene 1975 año
49.932
+3.361
7.22%
1 ene 1976 año
52.68
+2.748
5.5%
1 ene 1977 año
52.909
+0.228
0.43%
1 ene 1978 año
57.206
+4.297
8.12%
1 ene 1979 año
53.147
-4.058
-7.09%
1 ene 1980 año
61.186
+8.039
15.13%
1 ene 1981 año
62.44
+1.254
2.05%
1 ene 1982 año
70.981
+8.541
13.68%
1 ene 1983 año
70.72
-0.261
-0.37%
1 ene 1984 año
70.528
-0.192
-0.27%
1 ene 1985 año
67.537
-2.991
-4.24%
1 ene 1986 año
67.181
-0.356
-0.53%
1 ene 1987 año
65.011
-2.17
-3.23%
1 ene 1988 año
64.601
-0.41
-0.63%
1 ene 1989 año
65.973
+1.372
2.12%
1 ene 1990 año
66.225
+0.252
0.38%
1 ene 1991 año
63.606
-2.618
-3.95%
1 ene 1992 año
64.249
+0.642
1.01%
1 ene 1993 año
65.42
+1.171
1.82%
1 ene 1994 año
64.983
-0.437
-0.67%
1 ene 1995 año
63.374
-1.609
-2.48%
1 ene 1996 año
61.635
-1.739
-2.74%
1 ene 1997 año
60.733
-0.902
-1.46%
1 ene 1998 año
60.631
-0.101
-0.17%
1 ene 1999 año
61.229
+0.598
0.99%
1 ene 2000 año
61.455
+0.226
0.37%
1 ene 2001 año
60.696
-0.759
-1.24%
1 ene 2002 año
60.344
-0.352
-0.58%
1 ene 2003 año
57.106
-3.238
-5.37%
1 ene 2004 año
57.383
+0.277
0.49%
1 ene 2005 año
56.473
-0.91
-1.59%
1 ene 2006 año
53.149
-3.324
-5.89%
1 ene 2007 año
51.81
-1.338
-2.52%
1 ene 2008 año
50.619
-1.191
-2.3%
1 ene 2009 año
51.504
+0.885
1.75%
1 ene 2010 año
51.313
-0.19
-0.37%
1 ene 2011 año
49.88
-1.434
-2.79%
1 ene 2012 año
49.703
-0.177
-0.36%
1 ene 2013 año
50.314
+0.611
1.23%
1 ene 2014 año
49.875
-0.439
-0.87%
Ranking de los países por los datos estadísticos actuales


Comentarios: