29
/es/
es
AIzaSyAYiBZKx7MnpbEhh9jyipgxe19OcubqV5w
April 1, 2024
245332
South Africa
ZAF
true
2
1
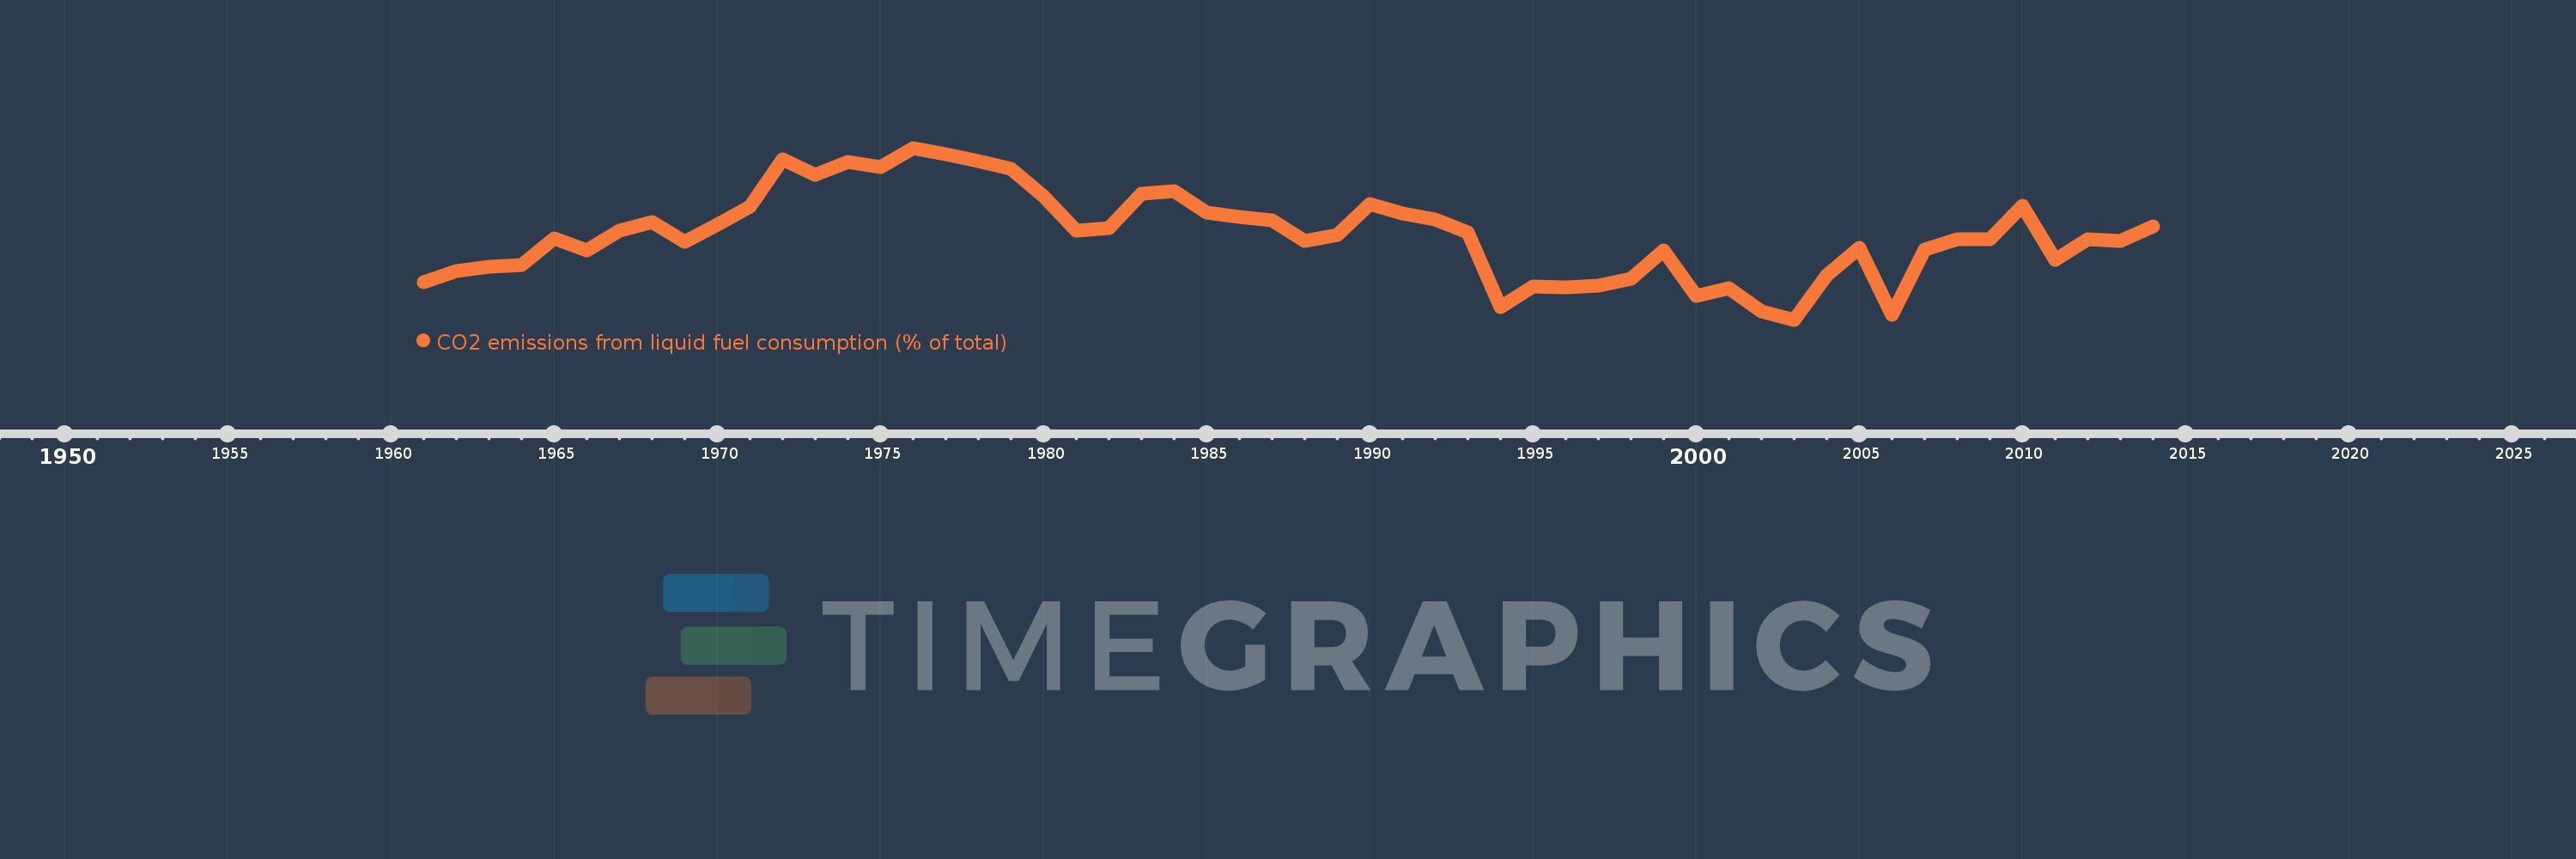
CO2 emissions from liquid fuel consumption (% of total)
2014,2013,2012,2011,2010,2009,2008,2007,2006,2005,2004,2003,2002,2001,2000,1999,1998,1997,1996,1995,1994,1993,1992,1991,1990,1989,1988,1987,1986,1985,1984,1983,1982,1981,1980,1979,1978,1977,1976,1975,1974,1973,1972,1971,1970,1969,1968,1967,1966,1965,1964,1963,1962,1961
Estas estadísticas en otros países:
AfghanistanAlbaniaAlgeriaAndorraAngolaAntigua and BarbudaArab WorldArgentinaArmeniaArubaAustraliaAustriaAzerbaijanBahamas, TheBahrainBangladeshBarbadosBelarusBelgiumBelizeBeninBermudaBhutanBoliviaBosnia and HerzegovinaBotswanaBrazilBritish Virgin IslandsBrunei DarussalamBulgariaBurkina FasoBurundiCabo VerdeCambodiaCameroonCanadaCaribbean small statesCayman IslandsCentral African RepublicCentral Europe and the BalticsChadChileChinaColombiaComorosCongo, Dem. Rep.Congo, Rep.Costa RicaCote d'IvoireCroatiaCubaCuracaoCyprusCzech RepublicDenmarkDjiboutiDominicaDominican RepublicEarly-demographic dividendEast Asia & PacificEast Asia & Pacific (excluding high income)East Asia & Pacific (IDA & IBRD countries)EcuadorEgypt, Arab Rep.El SalvadorEquatorial GuineaEritreaEstoniaEthiopiaEuro areaEurope & Central AsiaEurope & Central Asia (excluding high income)Europe & Central Asia (IDA & IBRD countries)European UnionFaroe IslandsFijiFinlandFragile and conflict affected situationsFranceFrench PolynesiaGabonGambia, TheGeorgiaGermanyGhanaGibraltarGreeceGreenlandGrenadaGuatemalaGuineaGuinea-BissauGuyanaHaitiHeavily indebted poor countries (HIPC)High incomeHondurasHong Kong SAR, ChinaHungaryIBRD onlyIcelandIDA & IBRD totalIDA blendIDA onlyIDA totalIndiaIndonesiaIran, Islamic Rep.IraqIrelandIsraelItalyJamaicaJapanJordanKazakhstanKenyaKiribatiKorea, Dem. People’s Rep.Korea, Rep.KuwaitKyrgyz RepublicLao PDRLate-demographic dividendLatin America & Caribbean Latin America & Caribbean (excluding high income)Latin America & the Caribbean (IDA & IBRD countries)LatviaLeast developed countries: UN classificationLebanonLesothoLiberiaLibyaLiechtensteinLithuaniaLow & middle incomeLow incomeLower middle incomeLuxembourgMacao SAR, ChinaMacedonia, FYRMadagascarMalawiMalaysiaMaldivesMaliMaltaMarshall IslandsMauritaniaMauritiusMexicoMicronesia, Fed. Sts.Middle East & North AfricaMiddle East & North Africa (excluding high income)Middle East & North Africa (IDA & IBRD countries)Middle incomeMoldovaMongoliaMontenegroMoroccoMozambiqueMyanmarNamibiaNauruNepalNetherlandsNew CaledoniaNew ZealandNicaraguaNigerNigeriaNorth AmericaNorwayOECD membersOmanOther small statesPacific island small statesPakistanPalauPanamaPapua New GuineaParaguayPeruPhilippinesPolandPortugalPost-demographic dividendPre-demographic dividendQatarRomaniaRussian FederationRwandaSamoaSao Tome and PrincipeSaudi ArabiaSenegalSerbiaSeychellesSierra LeoneSingaporeSint Maarten (Dutch part)Slovak RepublicSloveniaSmall statesSolomon IslandsSomaliaSouth AfricaSouth AsiaSouth Asia (IDA & IBRD)South SudanSpainSri LankaSt. Kitts and NevisSt. LuciaSt. Vincent and the GrenadinesSub-Saharan Africa Sub-Saharan Africa (excluding high income)Sub-Saharan Africa (IDA & IBRD countries)SudanSurinameSwazilandSwedenSwitzerlandSyrian Arab RepublicTajikistanTanzaniaThailandTimor-LesteTogoTongaTrinidad and TobagoTunisiaTurkeyTurkmenistanTurks and Caicos IslandsUgandaUkraineUnited Arab EmiratesUnited KingdomUnited StatesUpper middle incomeUruguayUzbekistanVanuatuVenezuela, RBVietnamWest Bank and GazaWorldYemen, Rep.ZambiaZimbabwe línea de tiempo (timeline):
En esta escala de tiempo se presenta un gráfico de 1961 y 2014 de South Africa. Los datos de 1960 están ausentes. El número de observaciones reales por fecha: 54.
Fuente (nombre):
Indicadores del desarrollo mundial
Fuente (organización):
Carbon Dioxide Information Analysis Center, Environmental Sciences Division, Oak Ridge National Laboratory, Tennessee, United States.
Categorías:
Climate Change, Environment
Se ha actualizado:
23 abr 2017 año
Los indicadores de los cambios de valor en los últimos años
Máximo:
19.996
1 ene 1976 año
A la fecha de observación
Valor
Cambio absoluto
El cambio con respecto al valor anterior
1 ene 1961 año
9.267
+9.267
0.0%
1 ene 1962 año
10.149
+0.882
9.52%
1 ene 1963 año
10.495
+0.346
3.4%
1 ene 1964 año
10.658
+0.163
1.55%
1 ene 1965 año
12.785
+2.128
19.96%
1 ene 1966 año
11.799
-0.986
-7.71%
1 ene 1967 año
13.425
+1.625
13.78%
1 ene 1968 año
14.108
+0.684
5.09%
1 ene 1969 año
12.537
-1.571
-11.13%
1 ene 1970 año
13.907
+1.37
10.93%
1 ene 1971 año
15.291
+1.384
9.95%
1 ene 1972 año
19.052
+3.761
24.6%
1 ene 1973 año
17.88
-1.172
-6.15%
1 ene 1974 año
18.877
+0.997
5.58%
1 ene 1975 año
18.464
-0.412
-2.19%
1 ene 1976 año
19.996
+1.532
8.3%
1 ene 1977 año
19.53
-0.466
-2.33%
1 ene 1978 año
18.978
-0.552
-2.83%
1 ene 1979 año
18.321
-0.657
-3.46%
1 ene 1980 año
16.145
-2.176
-11.88%
1 ene 1981 año
13.414
-2.731
-16.91%
1 ene 1982 año
13.601
+0.187
1.39%
1 ene 1983 año
16.318
+2.717
19.97%
1 ene 1984 año
16.519
+0.201
1.23%
1 ene 1985 año
14.836
-1.682
-10.18%
1 ene 1986 año
14.482
-0.354
-2.39%
1 ene 1987 año
14.2
-0.282
-1.95%
1 ene 1988 año
12.599
-1.601
-11.27%
1 ene 1989 año
13.093
+0.494
3.92%
1 ene 1990 año
15.514
+2.42
18.49%
1 ene 1991 año
14.74
-0.773
-4.98%
1 ene 1992 año
14.275
-0.466
-3.16%
1 ene 1993 año
13.292
-0.982
-6.88%
1 ene 1994 año
7.333
-5.959
-44.83%
1 ene 1995 año
8.965
+1.632
22.26%
1 ene 1996 año
8.912
-0.053
-0.59%
1 ene 1997 año
9.039
+0.127
1.43%
1 ene 1998 año
9.592
+0.553
6.12%
1 ene 1999 año
11.814
+2.222
23.16%
1 ene 2000 año
8.185
-3.628
-30.71%
1 ene 2001 año
8.802
+0.616
7.53%
1 ene 2002 año
6.964
-1.838
-20.89%
1 ene 2003 año
6.3
-0.664
-9.53%
1 ene 2004 año
9.834
+3.534
56.1%
1 ene 2005 año
12.058
+2.223
22.61%
1 ene 2006 año
6.681
-5.377
-44.59%
1 ene 2007 año
11.861
+5.18
77.53%
1 ene 2008 año
12.702
+0.842
7.1%
1 ene 2009 año
12.718
+0.016
0.12%
1 ene 2010 año
15.366
+2.647
20.82%
1 ene 2011 año
11.104
-4.262
-27.74%
1 ene 2012 año
12.733
+1.629
14.67%
1 ene 2013 año
12.557
-0.176
-1.38%
1 ene 2014 año
13.741
+1.184
9.43%
Ranking de los países por los datos estadísticos actuales


Comentarios: