29
/es/
es
AIzaSyAYiBZKx7MnpbEhh9jyipgxe19OcubqV5w
April 1, 2024
208635
New Caledonia
NCL
true
2
1
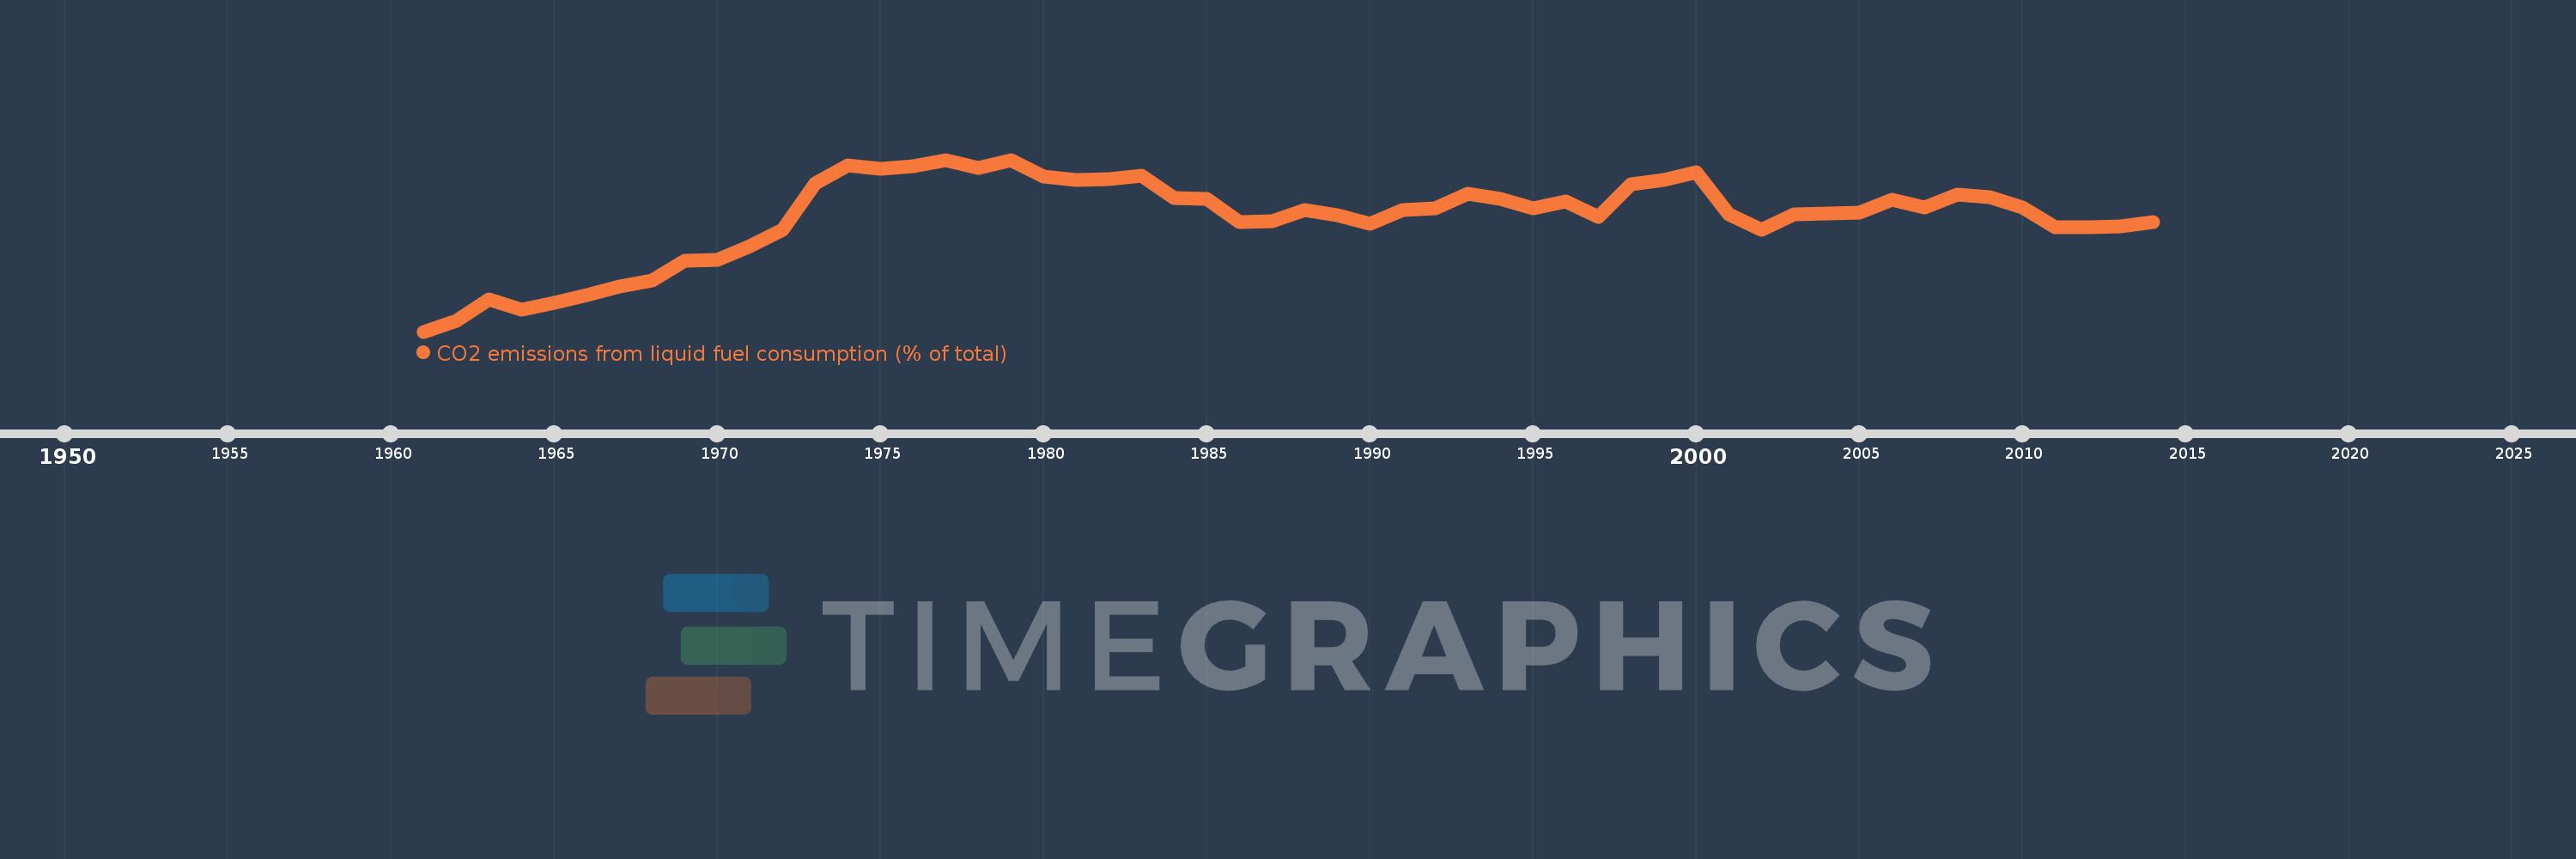
CO2 emissions from liquid fuel consumption (% of total)
2014,2013,2012,2011,2010,2009,2008,2007,2006,2005,2004,2003,2002,2001,2000,1999,1998,1997,1996,1995,1994,1993,1992,1991,1990,1989,1988,1987,1986,1985,1984,1983,1982,1981,1980,1979,1978,1977,1976,1975,1974,1973,1972,1971,1970,1969,1968,1967,1966,1965,1964,1963,1962,1961
Estas estadísticas en otros países:
AfghanistanAlbaniaAlgeriaAndorraAngolaAntigua and BarbudaArab WorldArgentinaArmeniaArubaAustraliaAustriaAzerbaijanBahamas, TheBahrainBangladeshBarbadosBelarusBelgiumBelizeBeninBermudaBhutanBoliviaBosnia and HerzegovinaBotswanaBrazilBritish Virgin IslandsBrunei DarussalamBulgariaBurkina FasoBurundiCabo VerdeCambodiaCameroonCanadaCaribbean small statesCayman IslandsCentral African RepublicCentral Europe and the BalticsChadChileChinaColombiaComorosCongo, Dem. Rep.Congo, Rep.Costa RicaCote d'IvoireCroatiaCubaCuracaoCyprusCzech RepublicDenmarkDjiboutiDominicaDominican RepublicEarly-demographic dividendEast Asia & PacificEast Asia & Pacific (excluding high income)East Asia & Pacific (IDA & IBRD countries)EcuadorEgypt, Arab Rep.El SalvadorEquatorial GuineaEritreaEstoniaEthiopiaEuro areaEurope & Central AsiaEurope & Central Asia (excluding high income)Europe & Central Asia (IDA & IBRD countries)European UnionFaroe IslandsFijiFinlandFragile and conflict affected situationsFranceFrench PolynesiaGabonGambia, TheGeorgiaGermanyGhanaGibraltarGreeceGreenlandGrenadaGuatemalaGuineaGuinea-BissauGuyanaHaitiHeavily indebted poor countries (HIPC)High incomeHondurasHong Kong SAR, ChinaHungaryIBRD onlyIcelandIDA & IBRD totalIDA blendIDA onlyIDA totalIndiaIndonesiaIran, Islamic Rep.IraqIrelandIsraelItalyJamaicaJapanJordanKazakhstanKenyaKiribatiKorea, Dem. People’s Rep.Korea, Rep.KuwaitKyrgyz RepublicLao PDRLate-demographic dividendLatin America & Caribbean Latin America & Caribbean (excluding high income)Latin America & the Caribbean (IDA & IBRD countries)LatviaLeast developed countries: UN classificationLebanonLesothoLiberiaLibyaLiechtensteinLithuaniaLow & middle incomeLow incomeLower middle incomeLuxembourgMacao SAR, ChinaMacedonia, FYRMadagascarMalawiMalaysiaMaldivesMaliMaltaMarshall IslandsMauritaniaMauritiusMexicoMicronesia, Fed. Sts.Middle East & North AfricaMiddle East & North Africa (excluding high income)Middle East & North Africa (IDA & IBRD countries)Middle incomeMoldovaMongoliaMontenegroMoroccoMozambiqueMyanmarNamibiaNauruNepalNetherlandsNew CaledoniaNew ZealandNicaraguaNigerNigeriaNorth AmericaNorwayOECD membersOmanOther small statesPacific island small statesPakistanPalauPanamaPapua New GuineaParaguayPeruPhilippinesPolandPortugalPost-demographic dividendPre-demographic dividendQatarRomaniaRussian FederationRwandaSamoaSao Tome and PrincipeSaudi ArabiaSenegalSerbiaSeychellesSierra LeoneSingaporeSint Maarten (Dutch part)Slovak RepublicSloveniaSmall statesSolomon IslandsSomaliaSouth AfricaSouth AsiaSouth Asia (IDA & IBRD)South SudanSpainSri LankaSt. Kitts and NevisSt. LuciaSt. Vincent and the GrenadinesSub-Saharan Africa Sub-Saharan Africa (excluding high income)Sub-Saharan Africa (IDA & IBRD countries)SudanSurinameSwazilandSwedenSwitzerlandSyrian Arab RepublicTajikistanTanzaniaThailandTimor-LesteTogoTongaTrinidad and TobagoTunisiaTurkeyTurkmenistanTurks and Caicos IslandsUgandaUkraineUnited Arab EmiratesUnited KingdomUnited StatesUpper middle incomeUruguayUzbekistanVanuatuVenezuela, RBVietnamWest Bank and GazaWorldYemen, Rep.ZambiaZimbabwe línea de tiempo (timeline):
En esta escala de tiempo se presenta un gráfico de 1961 y 2014 de New Caledonia. Los datos de 1960 están ausentes. El número de observaciones reales por fecha: 54.
Fuente (nombre):
Indicadores del desarrollo mundial
Fuente (organización):
Carbon Dioxide Information Analysis Center, Environmental Sciences Division, Oak Ridge National Laboratory, Tennessee, United States.
Categorías:
Climate Change, Environment
Se ha actualizado:
23 abr 2017 año
Los indicadores de los cambios de valor en los últimos años
Mínimo:
20.851
1 ene 1961 año
Máximo:
90.644
1 ene 1977 año
A la fecha de observación
Valor
Cambio absoluto
El cambio con respecto al valor anterior
1 ene 1961 año
20.851
+20.851
0.0%
1 ene 1962 año
25.207
+4.356
20.89%
1 ene 1963 año
33.766
+8.56
33.96%
1 ene 1964 año
29.586
-4.18
-12.38%
1 ene 1965 año
32.667
+3.081
10.41%
1 ene 1966 año
35.714
+3.048
9.33%
1 ene 1967 año
39.32
+3.606
10.1%
1 ene 1968 año
41.542
+2.222
5.65%
1 ene 1969 año
49.801
+8.259
19.88%
1 ene 1970 año
50.118
+0.317
0.64%
1 ene 1971 año
55.743
+5.625
11.22%
1 ene 1972 año
62.121
+6.378
11.44%
1 ene 1973 año
81.075
+18.954
30.51%
1 ene 1974 año
88.434
+7.359
9.08%
1 ene 1975 año
86.825
-1.61
-1.82%
1 ene 1976 año
88.116
+1.291
1.49%
1 ene 1977 año
90.644
+2.528
2.87%
1 ene 1978 año
87.158
-3.487
-3.85%
1 ene 1979 año
90.499
+3.341
3.83%
1 ene 1980 año
83.929
-6.57
-7.26%
1 ene 1981 año
82.601
-1.328
-1.58%
1 ene 1982 año
82.632
+0.031
0.04%
1 ene 1983 año
84.348
+1.716
2.08%
1 ene 1984 año
75.238
-9.11
-10.8%
1 ene 1985 año
74.772
-0.466
-0.62%
1 ene 1986 año
65.491
-9.281
-12.41%
1 ene 1987 año
65.535
+0.044
0.07%
1 ene 1988 año
70.101
+4.565
6.97%
1 ene 1989 año
68.127
-1.974
-2.82%
1 ene 1990 año
64.811
-3.316
-4.87%
1 ene 1991 año
70.37
+5.56
8.58%
1 ene 1992 año
70.954
+0.584
0.83%
1 ene 1993 año
76.852
+5.897
8.31%
1 ene 1994 año
74.85
-2.002
-2.6%
1 ene 1995 año
70.926
-3.924
-5.24%
1 ene 1996 año
73.852
+2.926
4.12%
1 ene 1997 año
67.279
-6.573
-8.9%
1 ene 1998 año
80.762
+13.483
20.04%
1 ene 1999 año
82.389
+1.627
2.01%
1 ene 2000 año
85.74
+3.351
4.07%
1 ene 2001 año
68.637
-17.103
-19.95%
1 ene 2002 año
62.33
-6.307
-9.19%
1 ene 2003 año
68.445
+6.115
9.81%
1 ene 2004 año
68.809
+0.363
0.53%
1 ene 2005 año
69.13
+0.322
0.47%
1 ene 2006 año
74.286
+5.155
7.46%
1 ene 2007 año
71.159
-3.127
-4.21%
1 ene 2008 año
76.588
+5.429
7.63%
1 ene 2009 año
75.32
-1.268
-1.66%
1 ene 2010 año
71.147
-4.173
-5.54%
1 ene 2011 año
63.354
-7.793
-10.95%
1 ene 2012 año
63.317
-0.037
-0.06%
1 ene 2013 año
63.434
+0.118
0.19%
1 ene 2014 año
65.242
+1.808
2.85%
Ranking de los países por los datos estadísticos actuales


Comentarios: