29
/es/
es
AIzaSyAYiBZKx7MnpbEhh9jyipgxe19OcubqV5w
April 1, 2024
73719
Austria
AUT
true
2
1
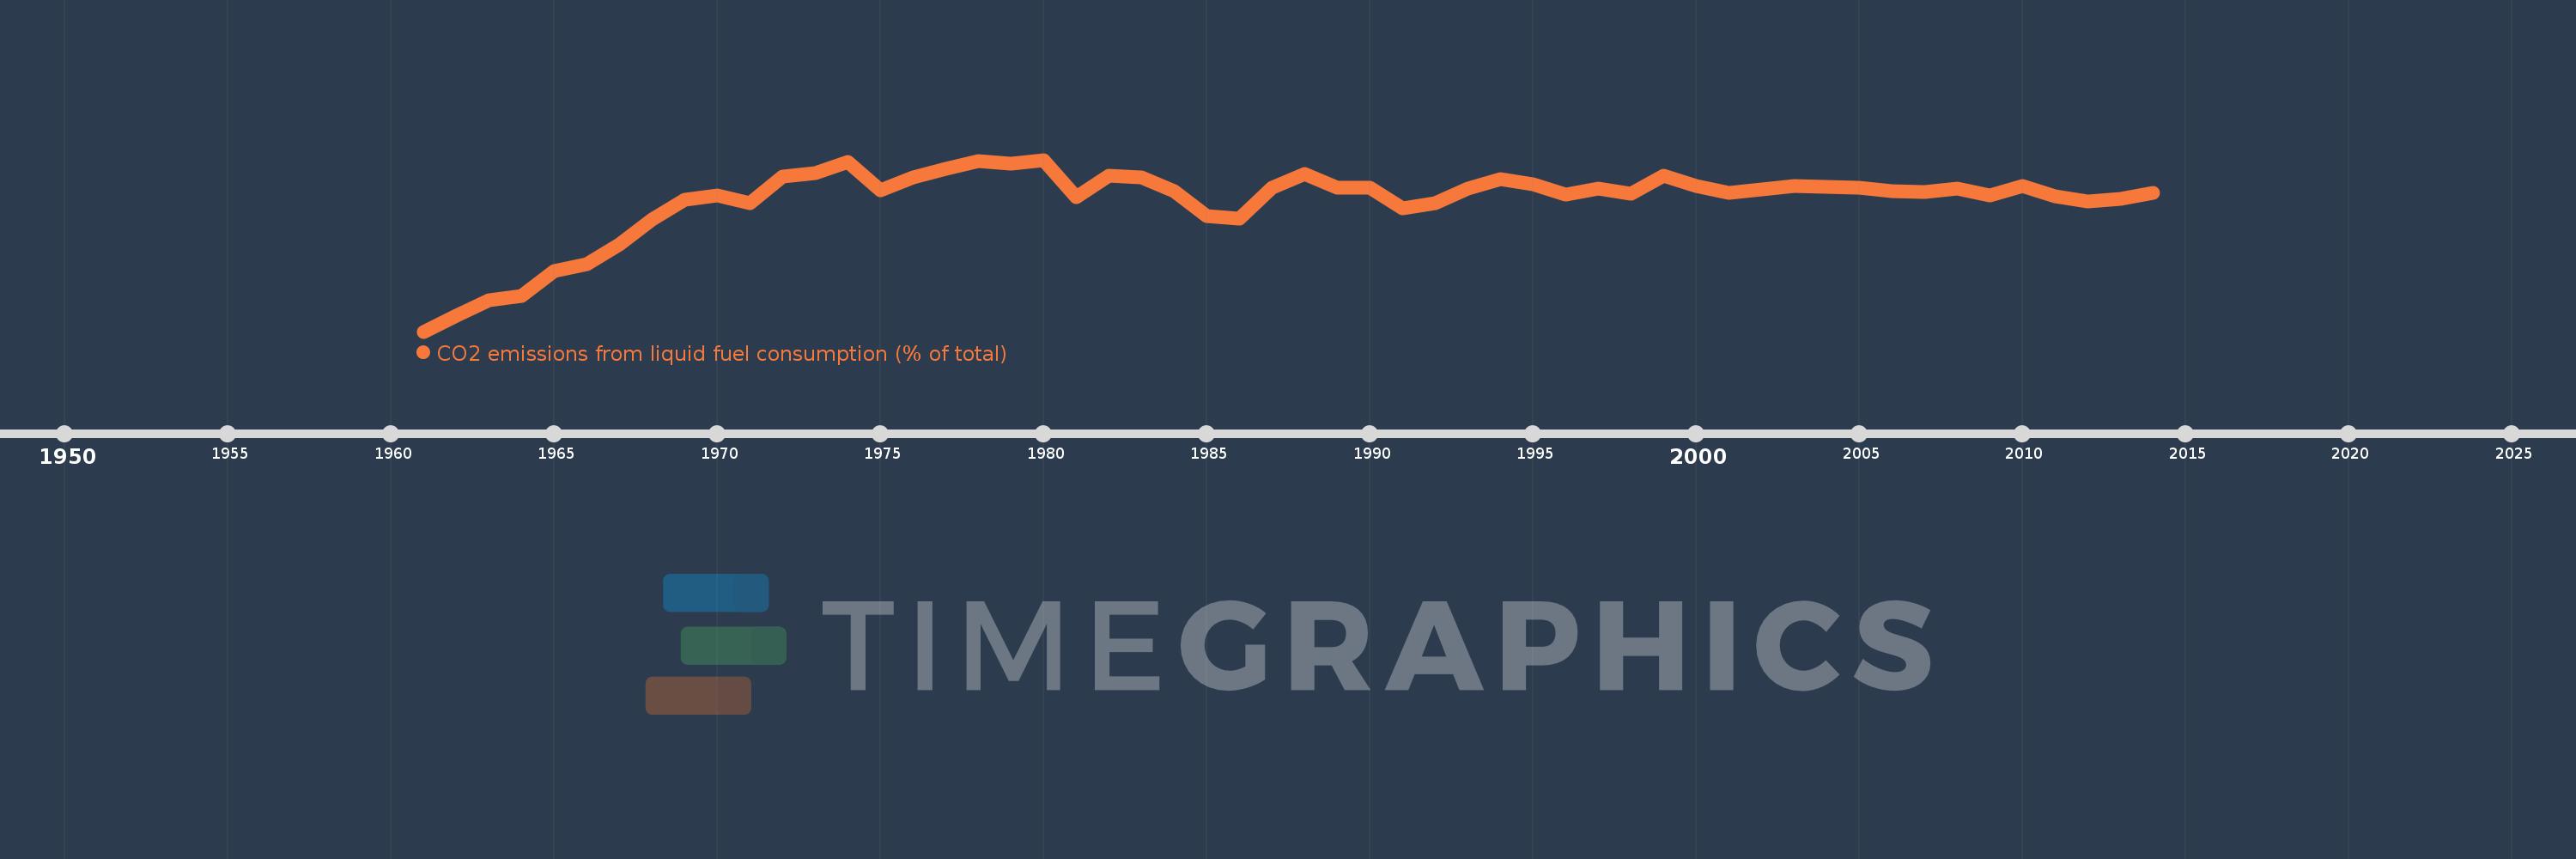
CO2 emissions from liquid fuel consumption (% of total)
2014,2013,2012,2011,2010,2009,2008,2007,2006,2005,2004,2003,2002,2001,2000,1999,1998,1997,1996,1995,1994,1993,1992,1991,1990,1989,1988,1987,1986,1985,1984,1983,1982,1981,1980,1979,1978,1977,1976,1975,1974,1973,1972,1971,1970,1969,1968,1967,1966,1965,1964,1963,1962,1961
Estas estadísticas en otros países:
AfghanistanAlbaniaAlgeriaAndorraAngolaAntigua and BarbudaArab WorldArgentinaArmeniaArubaAustraliaAustriaAzerbaijanBahamas, TheBahrainBangladeshBarbadosBelarusBelgiumBelizeBeninBermudaBhutanBoliviaBosnia and HerzegovinaBotswanaBrazilBritish Virgin IslandsBrunei DarussalamBulgariaBurkina FasoBurundiCabo VerdeCambodiaCameroonCanadaCaribbean small statesCayman IslandsCentral African RepublicCentral Europe and the BalticsChadChileChinaColombiaComorosCongo, Dem. Rep.Congo, Rep.Costa RicaCote d'IvoireCroatiaCubaCuracaoCyprusCzech RepublicDenmarkDjiboutiDominicaDominican RepublicEarly-demographic dividendEast Asia & PacificEast Asia & Pacific (excluding high income)East Asia & Pacific (IDA & IBRD countries)EcuadorEgypt, Arab Rep.El SalvadorEquatorial GuineaEritreaEstoniaEthiopiaEuro areaEurope & Central AsiaEurope & Central Asia (excluding high income)Europe & Central Asia (IDA & IBRD countries)European UnionFaroe IslandsFijiFinlandFragile and conflict affected situationsFranceFrench PolynesiaGabonGambia, TheGeorgiaGermanyGhanaGibraltarGreeceGreenlandGrenadaGuatemalaGuineaGuinea-BissauGuyanaHaitiHeavily indebted poor countries (HIPC)High incomeHondurasHong Kong SAR, ChinaHungaryIBRD onlyIcelandIDA & IBRD totalIDA blendIDA onlyIDA totalIndiaIndonesiaIran, Islamic Rep.IraqIrelandIsraelItalyJamaicaJapanJordanKazakhstanKenyaKiribatiKorea, Dem. People’s Rep.Korea, Rep.KuwaitKyrgyz RepublicLao PDRLate-demographic dividendLatin America & Caribbean Latin America & Caribbean (excluding high income)Latin America & the Caribbean (IDA & IBRD countries)LatviaLeast developed countries: UN classificationLebanonLesothoLiberiaLibyaLiechtensteinLithuaniaLow & middle incomeLow incomeLower middle incomeLuxembourgMacao SAR, ChinaMacedonia, FYRMadagascarMalawiMalaysiaMaldivesMaliMaltaMarshall IslandsMauritaniaMauritiusMexicoMicronesia, Fed. Sts.Middle East & North AfricaMiddle East & North Africa (excluding high income)Middle East & North Africa (IDA & IBRD countries)Middle incomeMoldovaMongoliaMontenegroMoroccoMozambiqueMyanmarNamibiaNauruNepalNetherlandsNew CaledoniaNew ZealandNicaraguaNigerNigeriaNorth AmericaNorwayOECD membersOmanOther small statesPacific island small statesPakistanPalauPanamaPapua New GuineaParaguayPeruPhilippinesPolandPortugalPost-demographic dividendPre-demographic dividendQatarRomaniaRussian FederationRwandaSamoaSao Tome and PrincipeSaudi ArabiaSenegalSerbiaSeychellesSierra LeoneSingaporeSint Maarten (Dutch part)Slovak RepublicSloveniaSmall statesSolomon IslandsSomaliaSouth AfricaSouth AsiaSouth Asia (IDA & IBRD)South SudanSpainSri LankaSt. Kitts and NevisSt. LuciaSt. Vincent and the GrenadinesSub-Saharan Africa Sub-Saharan Africa (excluding high income)Sub-Saharan Africa (IDA & IBRD countries)SudanSurinameSwazilandSwedenSwitzerlandSyrian Arab RepublicTajikistanTanzaniaThailandTimor-LesteTogoTongaTrinidad and TobagoTunisiaTurkeyTurkmenistanTurks and Caicos IslandsUgandaUkraineUnited Arab EmiratesUnited KingdomUnited StatesUpper middle incomeUruguayUzbekistanVanuatuVenezuela, RBVietnamWest Bank and GazaWorldYemen, Rep.ZambiaZimbabwe línea de tiempo (timeline):
En esta escala de tiempo se presenta un gráfico de 1961 y 2014 de Austria. Los datos de 1960 están ausentes. El número de observaciones reales por fecha: 54.
Fuente (nombre):
Indicadores del desarrollo mundial
Fuente (organización):
Carbon Dioxide Information Analysis Center, Environmental Sciences Division, Oak Ridge National Laboratory, Tennessee, United States.
Categorías:
Climate Change, Environment
Se ha actualizado:
23 abr 2017 año
Los indicadores de los cambios de valor en los últimos años
Mínimo:
27.329
1 ene 1961 año
Máximo:
56.141
1 ene 1980 año
A la fecha de observación
Valor
Cambio absoluto
El cambio con respecto al valor anterior
1 ene 1961 año
27.329
+27.329
0.0%
1 ene 1962 año
30.003
+2.674
9.79%
1 ene 1963 año
32.544
+2.54
8.47%
1 ene 1964 año
33.376
+0.832
2.56%
1 ene 1965 año
37.448
+4.072
12.2%
1 ene 1966 año
38.669
+1.221
3.26%
1 ene 1967 año
41.976
+3.307
8.55%
1 ene 1968 año
46.078
+4.101
9.77%
1 ene 1969 año
49.424
+3.347
7.26%
1 ene 1970 año
50.123
+0.699
1.41%
1 ene 1971 año
48.922
-1.201
-2.4%
1 ene 1972 año
53.294
+4.372
8.94%
1 ene 1973 año
53.909
+0.615
1.15%
1 ene 1974 año
55.763
+1.854
3.44%
1 ene 1975 año
51.091
-4.672
-8.38%
1 ene 1976 año
53.118
+2.027
3.97%
1 ene 1977 año
54.658
+1.54
2.9%
1 ene 1978 año
55.913
+1.255
2.3%
1 ene 1979 año
55.48
-0.433
-0.77%
1 ene 1980 año
56.141
+0.661
1.19%
1 ene 1981 año
49.888
-6.253
-11.14%
1 ene 1982 año
53.472
+3.584
7.18%
1 ene 1983 año
53.233
-0.239
-0.45%
1 ene 1984 año
50.861
-2.373
-4.46%
1 ene 1985 año
46.773
-4.087
-8.04%
1 ene 1986 año
46.336
-0.437
-0.93%
1 ene 1987 año
51.424
+5.088
10.98%
1 ene 1988 año
53.75
+2.326
4.52%
1 ene 1989 año
51.423
-2.327
-4.33%
1 ene 1990 año
51.437
+0.013
0.03%
1 ene 1991 año
47.95
-3.487
-6.78%
1 ene 1992 año
48.881
+0.931
1.94%
1 ene 1993 año
51.317
+2.436
4.98%
1 ene 1994 año
52.877
+1.56
3.04%
1 ene 1995 año
51.983
-0.894
-1.69%
1 ene 1996 año
50.267
-1.716
-3.3%
1 ene 1997 año
51.338
+1.071
2.13%
1 ene 1998 año
50.518
-0.82
-1.6%
1 ene 1999 año
53.413
+2.895
5.73%
1 ene 2000 año
51.754
-1.658
-3.1%
1 ene 2001 año
50.567
-1.188
-2.3%
1 ene 2002 año
51.233
+0.666
1.32%
1 ene 2003 año
51.713
+0.48
0.94%
1 ene 2004 año
51.545
-0.167
-0.32%
1 ene 2005 año
51.452
-0.093
-0.18%
1 ene 2006 año
50.857
-0.595
-1.16%
1 ene 2007 año
50.734
-0.123
-0.24%
1 ene 2008 año
51.357
+0.623
1.23%
1 ene 2009 año
50.104
-1.253
-2.44%
1 ene 2010 año
51.742
+1.638
3.27%
1 ene 2011 año
49.984
-1.758
-3.4%
1 ene 2012 año
49.084
-0.9
-1.8%
1 ene 2013 año
49.543
+0.459
0.94%
1 ene 2014 año
50.632
+1.088
2.2%
Ranking de los países por los datos estadísticos actuales


Comentarios: