29
/es/
es
AIzaSyAYiBZKx7MnpbEhh9jyipgxe19OcubqV5w
April 1, 2024
223305
Philippines
PHL
true
2
1
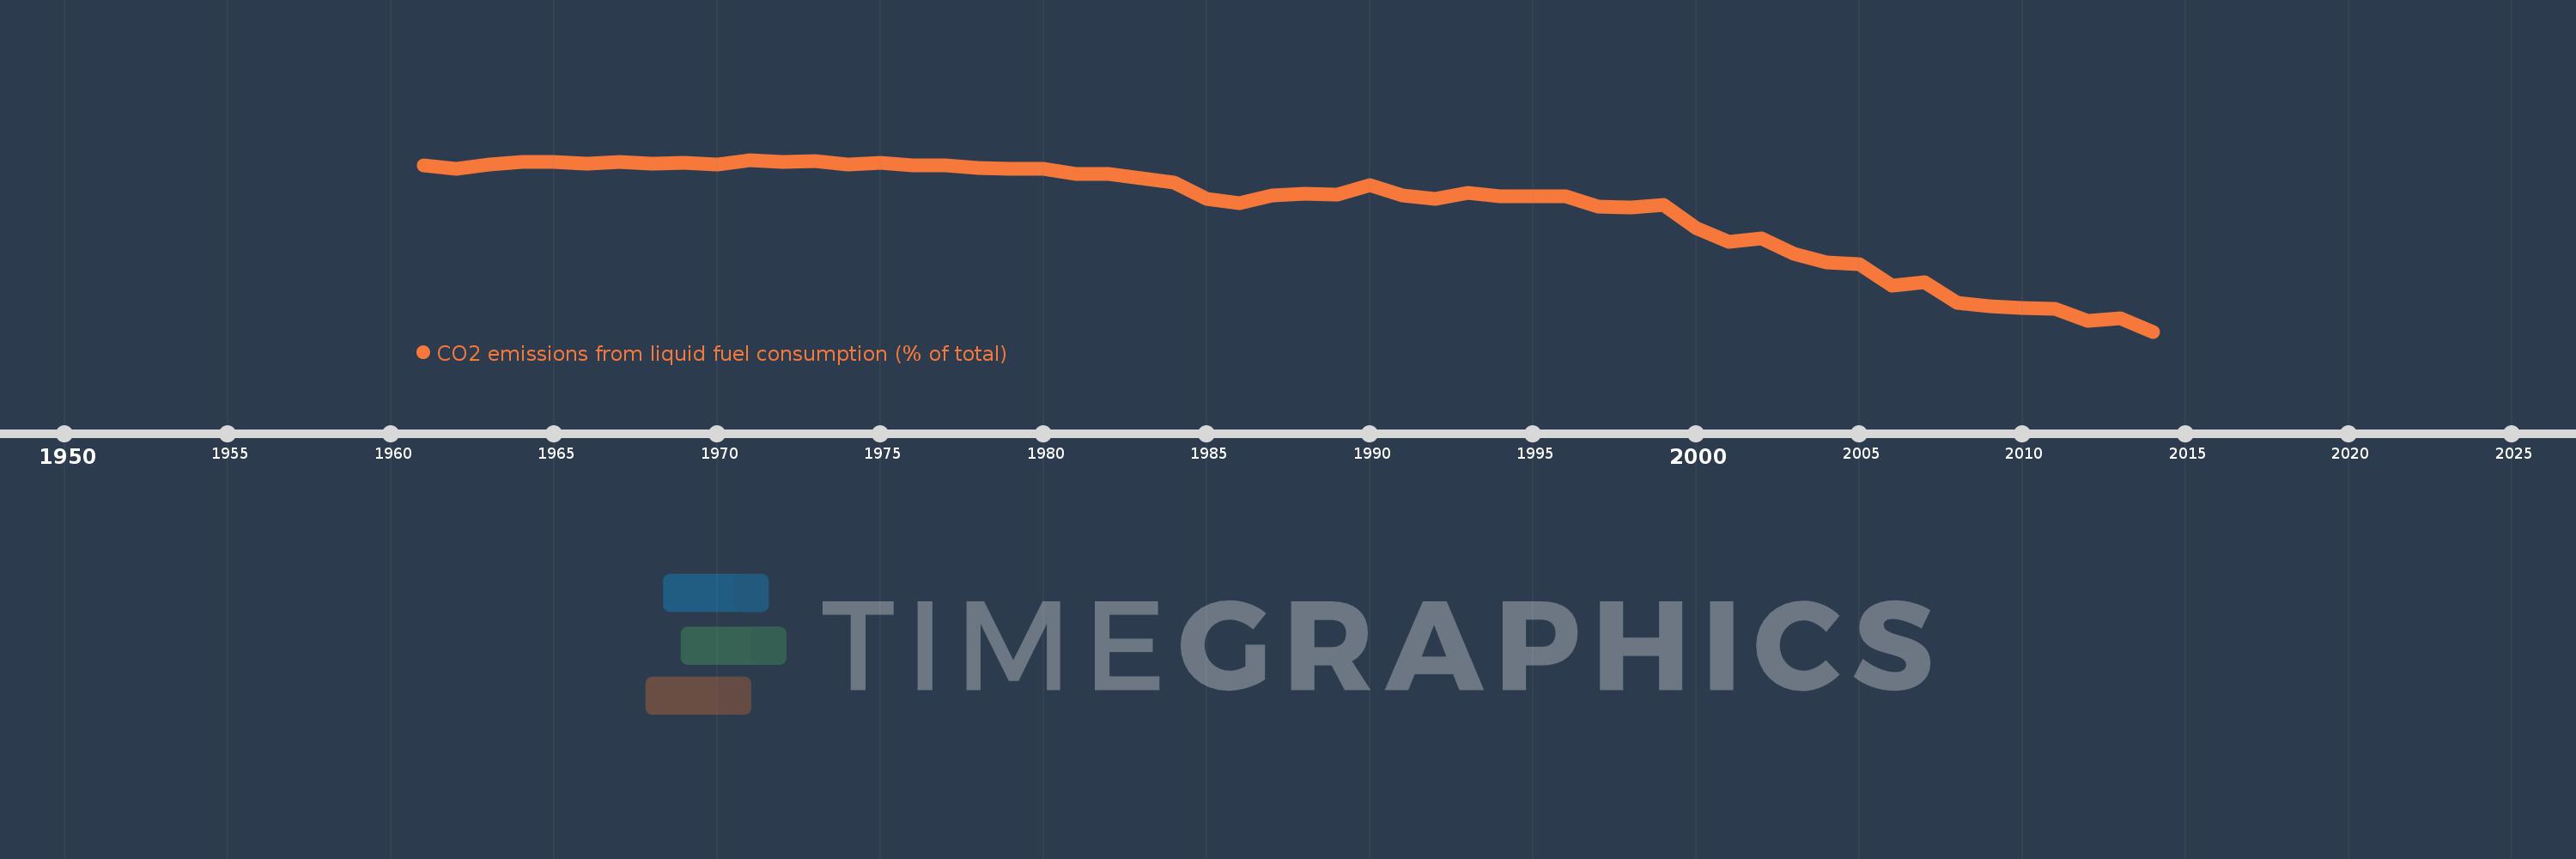
CO2 emissions from liquid fuel consumption (% of total)
2014,2013,2012,2011,2010,2009,2008,2007,2006,2005,2004,2003,2002,2001,2000,1999,1998,1997,1996,1995,1994,1993,1992,1991,1990,1989,1988,1987,1986,1985,1984,1983,1982,1981,1980,1979,1978,1977,1976,1975,1974,1973,1972,1971,1970,1969,1968,1967,1966,1965,1964,1963,1962,1961
Estas estadísticas en otros países:
AfghanistanAlbaniaAlgeriaAndorraAngolaAntigua and BarbudaArab WorldArgentinaArmeniaArubaAustraliaAustriaAzerbaijanBahamas, TheBahrainBangladeshBarbadosBelarusBelgiumBelizeBeninBermudaBhutanBoliviaBosnia and HerzegovinaBotswanaBrazilBritish Virgin IslandsBrunei DarussalamBulgariaBurkina FasoBurundiCabo VerdeCambodiaCameroonCanadaCaribbean small statesCayman IslandsCentral African RepublicCentral Europe and the BalticsChadChileChinaColombiaComorosCongo, Dem. Rep.Congo, Rep.Costa RicaCote d'IvoireCroatiaCubaCuracaoCyprusCzech RepublicDenmarkDjiboutiDominicaDominican RepublicEarly-demographic dividendEast Asia & PacificEast Asia & Pacific (excluding high income)East Asia & Pacific (IDA & IBRD countries)EcuadorEgypt, Arab Rep.El SalvadorEquatorial GuineaEritreaEstoniaEthiopiaEuro areaEurope & Central AsiaEurope & Central Asia (excluding high income)Europe & Central Asia (IDA & IBRD countries)European UnionFaroe IslandsFijiFinlandFragile and conflict affected situationsFranceFrench PolynesiaGabonGambia, TheGeorgiaGermanyGhanaGibraltarGreeceGreenlandGrenadaGuatemalaGuineaGuinea-BissauGuyanaHaitiHeavily indebted poor countries (HIPC)High incomeHondurasHong Kong SAR, ChinaHungaryIBRD onlyIcelandIDA & IBRD totalIDA blendIDA onlyIDA totalIndiaIndonesiaIran, Islamic Rep.IraqIrelandIsraelItalyJamaicaJapanJordanKazakhstanKenyaKiribatiKorea, Dem. People’s Rep.Korea, Rep.KuwaitKyrgyz RepublicLao PDRLate-demographic dividendLatin America & Caribbean Latin America & Caribbean (excluding high income)Latin America & the Caribbean (IDA & IBRD countries)LatviaLeast developed countries: UN classificationLebanonLesothoLiberiaLibyaLiechtensteinLithuaniaLow & middle incomeLow incomeLower middle incomeLuxembourgMacao SAR, ChinaMacedonia, FYRMadagascarMalawiMalaysiaMaldivesMaliMaltaMarshall IslandsMauritaniaMauritiusMexicoMicronesia, Fed. Sts.Middle East & North AfricaMiddle East & North Africa (excluding high income)Middle East & North Africa (IDA & IBRD countries)Middle incomeMoldovaMongoliaMontenegroMoroccoMozambiqueMyanmarNamibiaNauruNepalNetherlandsNew CaledoniaNew ZealandNicaraguaNigerNigeriaNorth AmericaNorwayOECD membersOmanOther small statesPacific island small statesPakistanPalauPanamaPapua New GuineaParaguayPeruPhilippinesPolandPortugalPost-demographic dividendPre-demographic dividendQatarRomaniaRussian FederationRwandaSamoaSao Tome and PrincipeSaudi ArabiaSenegalSerbiaSeychellesSierra LeoneSingaporeSint Maarten (Dutch part)Slovak RepublicSloveniaSmall statesSolomon IslandsSomaliaSouth AfricaSouth AsiaSouth Asia (IDA & IBRD)South SudanSpainSri LankaSt. Kitts and NevisSt. LuciaSt. Vincent and the GrenadinesSub-Saharan Africa Sub-Saharan Africa (excluding high income)Sub-Saharan Africa (IDA & IBRD countries)SudanSurinameSwazilandSwedenSwitzerlandSyrian Arab RepublicTajikistanTanzaniaThailandTimor-LesteTogoTongaTrinidad and TobagoTunisiaTurkeyTurkmenistanTurks and Caicos IslandsUgandaUkraineUnited Arab EmiratesUnited KingdomUnited StatesUpper middle incomeUruguayUzbekistanVanuatuVenezuela, RBVietnamWest Bank and GazaWorldYemen, Rep.ZambiaZimbabwe línea de tiempo (timeline):
En esta escala de tiempo se presenta un gráfico de 1961 y 2014 de Philippines. Los datos de 1960 están ausentes. El número de observaciones reales por fecha: 54.
Fuente (nombre):
Indicadores del desarrollo mundial
Fuente (organización):
Carbon Dioxide Information Analysis Center, Environmental Sciences Division, Oak Ridge National Laboratory, Tennessee, United States.
Categorías:
Climate Change, Environment
Se ha actualizado:
23 abr 2017 año
Los indicadores de los cambios de valor en los últimos años
Mínimo:
42.019
1 ene 2014 año
Máximo:
94.732
1 ene 1971 año
A la fecha de observación
Valor
Cambio absoluto
El cambio con respecto al valor anterior
1 ene 1961 año
93.093
+93.093
0.0%
1 ene 1962 año
92.055
-1.037
-1.11%
1 ene 1963 año
93.303
+1.247
1.35%
1 ene 1964 año
94.125
+0.823
0.88%
1 ene 1965 año
94.173
+0.048
0.05%
1 ene 1966 año
93.443
-0.73
-0.77%
1 ene 1967 año
94.178
+0.734
0.79%
1 ene 1968 año
93.644
-0.533
-0.57%
1 ene 1969 año
93.853
+0.209
0.22%
1 ene 1970 año
93.231
-0.622
-0.66%
1 ene 1971 año
94.732
+1.501
1.61%
1 ene 1972 año
94.085
-0.647
-0.68%
1 ene 1973 año
94.231
+0.146
0.16%
1 ene 1974 año
93.385
-0.846
-0.9%
1 ene 1975 año
93.911
+0.525
0.56%
1 ene 1976 año
92.999
-0.912
-0.97%
1 ene 1977 año
93.121
+0.122
0.13%
1 ene 1978 año
92.338
-0.783
-0.84%
1 ene 1979 año
91.879
-0.459
-0.5%
1 ene 1980 año
91.952
+0.073
0.08%
1 ene 1981 año
90.317
-1.635
-1.78%
1 ene 1982 año
90.373
+0.056
0.06%
1 ene 1983 año
89.197
-1.176
-1.3%
1 ene 1984 año
87.616
-1.581
-1.77%
1 ene 1985 año
82.619
-4.997
-5.7%
1 ene 1986 año
81.54
-1.079
-1.31%
1 ene 1987 año
83.905
+2.365
2.9%
1 ene 1988 año
84.349
+0.444
0.53%
1 ene 1989 año
84.138
-0.21
-0.25%
1 ene 1990 año
86.875
+2.736
3.25%
1 ene 1991 año
83.765
-3.11
-3.58%
1 ene 1992 año
82.746
-1.019
-1.22%
1 ene 1993 año
84.498
+1.752
2.12%
1 ene 1994 año
83.496
-1.002
-1.19%
1 ene 1995 año
83.632
+0.136
0.16%
1 ene 1996 año
83.577
-0.055
-0.07%
1 ene 1997 año
80.498
-3.079
-3.68%
1 ene 1998 año
80.144
-0.354
-0.44%
1 ene 1999 año
80.775
+0.631
0.79%
1 ene 2000 año
73.743
-7.032
-8.71%
1 ene 2001 año
69.581
-4.162
-5.64%
1 ene 2002 año
70.505
+0.923
1.33%
1 ene 2003 año
65.992
-4.513
-6.4%
1 ene 2004 año
63.147
-2.845
-4.31%
1 ene 2005 año
62.833
-0.314
-0.5%
1 ene 2006 año
56.138
-6.695
-10.66%
1 ene 2007 año
57.145
+1.008
1.79%
1 ene 2008 año
50.81
-6.335
-11.09%
1 ene 2009 año
49.784
-1.027
-2.02%
1 ene 2010 año
49.322
-0.462
-0.93%
1 ene 2011 año
49.037
-0.285
-0.58%
1 ene 2012 año
45.34
-3.697
-7.54%
1 ene 2013 año
45.974
+0.634
1.4%
1 ene 2014 año
42.019
-3.955
-8.6%
Ranking de los países por los datos estadísticos actuales


Comentarios: