29
/es/
es
AIzaSyAYiBZKx7MnpbEhh9jyipgxe19OcubqV5w
April 1, 2024
54619
Post-demographic dividend
PST
false
2
1
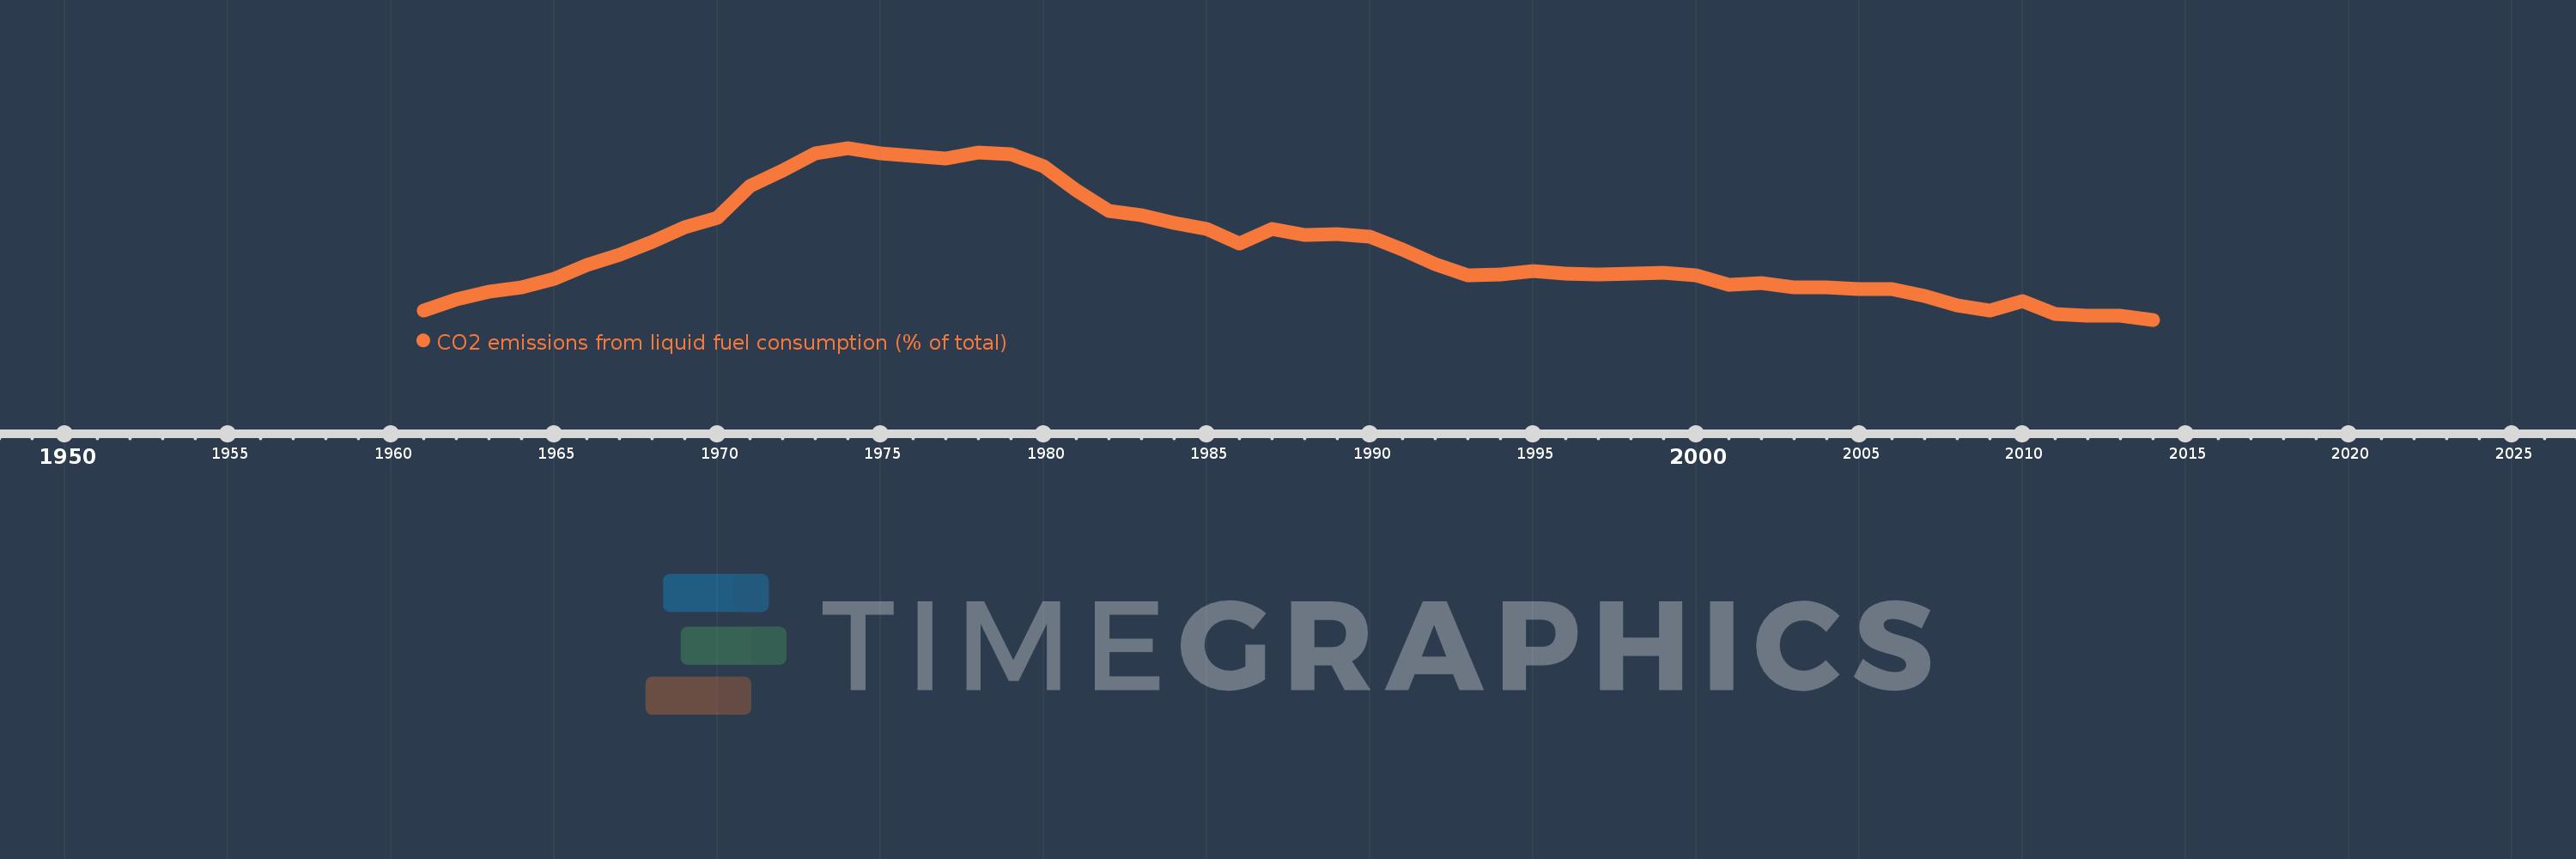
CO2 emissions from liquid fuel consumption (% of total)
2014,2013,2012,2011,2010,2009,2008,2007,2006,2005,2004,2003,2002,2001,2000,1999,1998,1997,1996,1995,1994,1993,1992,1991,1990,1989,1988,1987,1986,1985,1984,1983,1982,1981,1980,1979,1978,1977,1976,1975,1974,1973,1972,1971,1970,1969,1968,1967,1966,1965,1964,1963,1962,1961
Estas estadísticas en otros países:
AfghanistanAlbaniaAlgeriaAndorraAngolaAntigua and BarbudaArab WorldArgentinaArmeniaArubaAustraliaAustriaAzerbaijanBahamas, TheBahrainBangladeshBarbadosBelarusBelgiumBelizeBeninBermudaBhutanBoliviaBosnia and HerzegovinaBotswanaBrazilBritish Virgin IslandsBrunei DarussalamBulgariaBurkina FasoBurundiCabo VerdeCambodiaCameroonCanadaCaribbean small statesCayman IslandsCentral African RepublicCentral Europe and the BalticsChadChileChinaColombiaComorosCongo, Dem. Rep.Congo, Rep.Costa RicaCote d'IvoireCroatiaCubaCuracaoCyprusCzech RepublicDenmarkDjiboutiDominicaDominican RepublicEarly-demographic dividendEast Asia & PacificEast Asia & Pacific (excluding high income)East Asia & Pacific (IDA & IBRD countries)EcuadorEgypt, Arab Rep.El SalvadorEquatorial GuineaEritreaEstoniaEthiopiaEuro areaEurope & Central AsiaEurope & Central Asia (excluding high income)Europe & Central Asia (IDA & IBRD countries)European UnionFaroe IslandsFijiFinlandFragile and conflict affected situationsFranceFrench PolynesiaGabonGambia, TheGeorgiaGermanyGhanaGibraltarGreeceGreenlandGrenadaGuatemalaGuineaGuinea-BissauGuyanaHaitiHeavily indebted poor countries (HIPC)High incomeHondurasHong Kong SAR, ChinaHungaryIBRD onlyIcelandIDA & IBRD totalIDA blendIDA onlyIDA totalIndiaIndonesiaIran, Islamic Rep.IraqIrelandIsraelItalyJamaicaJapanJordanKazakhstanKenyaKiribatiKorea, Dem. People’s Rep.Korea, Rep.KuwaitKyrgyz RepublicLao PDRLate-demographic dividendLatin America & Caribbean Latin America & Caribbean (excluding high income)Latin America & the Caribbean (IDA & IBRD countries)LatviaLeast developed countries: UN classificationLebanonLesothoLiberiaLibyaLiechtensteinLithuaniaLow & middle incomeLow incomeLower middle incomeLuxembourgMacao SAR, ChinaMacedonia, FYRMadagascarMalawiMalaysiaMaldivesMaliMaltaMarshall IslandsMauritaniaMauritiusMexicoMicronesia, Fed. Sts.Middle East & North AfricaMiddle East & North Africa (excluding high income)Middle East & North Africa (IDA & IBRD countries)Middle incomeMoldovaMongoliaMontenegroMoroccoMozambiqueMyanmarNamibiaNauruNepalNetherlandsNew CaledoniaNew ZealandNicaraguaNigerNigeriaNorth AmericaNorwayOECD membersOmanOther small statesPacific island small statesPakistanPalauPanamaPapua New GuineaParaguayPeruPhilippinesPolandPortugalPost-demographic dividendPre-demographic dividendQatarRomaniaRussian FederationRwandaSamoaSao Tome and PrincipeSaudi ArabiaSenegalSerbiaSeychellesSierra LeoneSingaporeSint Maarten (Dutch part)Slovak RepublicSloveniaSmall statesSolomon IslandsSomaliaSouth AfricaSouth AsiaSouth Asia (IDA & IBRD)South SudanSpainSri LankaSt. Kitts and NevisSt. LuciaSt. Vincent and the GrenadinesSub-Saharan Africa Sub-Saharan Africa (excluding high income)Sub-Saharan Africa (IDA & IBRD countries)SudanSurinameSwazilandSwedenSwitzerlandSyrian Arab RepublicTajikistanTanzaniaThailandTimor-LesteTogoTongaTrinidad and TobagoTunisiaTurkeyTurkmenistanTurks and Caicos IslandsUgandaUkraineUnited Arab EmiratesUnited KingdomUnited StatesUpper middle incomeUruguayUzbekistanVanuatuVenezuela, RBVietnamWest Bank and GazaWorldYemen, Rep.ZambiaZimbabwe línea de tiempo (timeline):
En esta escala de tiempo se presenta un gráfico de 1961 y 2014 de Post-demographic dividend. Los datos de 1960 están ausentes. El número de observaciones reales por fecha: 54.
Fuente (nombre):
Indicadores del desarrollo mundial
Fuente (organización):
Carbon Dioxide Information Analysis Center, Environmental Sciences Division, Oak Ridge National Laboratory, Tennessee, United States.
Categorías:
Climate Change, Environment
Se ha actualizado:
23 abr 2017 año
Los indicadores de los cambios de valor en los últimos años
Mínimo:
39.53
1 ene 2014 año
Máximo:
56.396
1 ene 1974 año
A la fecha de observación
Valor
Cambio absoluto
El cambio con respecto al valor anterior
1 ene 1961 año
40.471
+40.471
0.0%
1 ene 1962 año
41.497
+1.026
2.54%
1 ene 1963 año
42.323
+0.826
1.99%
1 ene 1964 año
42.741
+0.418
0.99%
1 ene 1965 año
43.574
+0.834
1.95%
1 ene 1966 año
44.891
+1.316
3.02%
1 ene 1967 año
45.917
+1.026
2.29%
1 ene 1968 año
47.157
+1.24
2.7%
1 ene 1969 año
48.583
+1.426
3.02%
1 ene 1970 año
49.562
+0.979
2.02%
1 ene 1971 año
52.671
+3.108
6.27%
1 ene 1972 año
54.178
+1.507
2.86%
1 ene 1973 año
55.887
+1.709
3.15%
1 ene 1974 año
56.396
+0.509
0.91%
1 ene 1975 año
55.83
-0.566
-1.0%
1 ene 1976 año
55.649
-0.181
-0.32%
1 ene 1977 año
55.349
-0.3
-0.54%
1 ene 1978 año
55.986
+0.637
1.15%
1 ene 1979 año
55.812
-0.174
-0.31%
1 ene 1980 año
54.569
-1.243
-2.23%
1 ene 1981 año
52.268
-2.301
-4.22%
1 ene 1982 año
50.216
-2.052
-3.93%
1 ene 1983 año
49.793
-0.423
-0.84%
1 ene 1984 año
49.074
-0.719
-1.44%
1 ene 1985 año
48.426
-0.648
-1.32%
1 ene 1986 año
47.026
-1.4
-2.89%
1 ene 1987 año
48.482
+1.456
3.1%
1 ene 1988 año
47.873
-0.609
-1.26%
1 ene 1989 año
47.957
+0.084
0.18%
1 ene 1990 año
47.664
-0.293
-0.61%
1 ene 1991 año
46.454
-1.21
-2.54%
1 ene 1992 año
44.987
-1.467
-3.16%
1 ene 1993 año
43.898
-1.089
-2.42%
1 ene 1994 año
43.967
+0.07
0.16%
1 ene 1995 año
44.296
+0.328
0.75%
1 ene 1996 año
44.026
-0.27
-0.61%
1 ene 1997 año
43.941
-0.085
-0.19%
1 ene 1998 año
44.04
+0.099
0.22%
1 ene 1999 año
44.149
+0.109
0.25%
1 ene 2000 año
43.872
-0.278
-0.63%
1 ene 2001 año
42.923
-0.948
-2.16%
1 ene 2002 año
43.153
+0.23
0.54%
1 ene 2003 año
42.699
-0.455
-1.05%
1 ene 2004 año
42.722
+0.023
0.05%
1 ene 2005 año
42.573
-0.149
-0.35%
1 ene 2006 año
42.549
-0.024
-0.06%
1 ene 2007 año
41.899
-0.65
-1.53%
1 ene 2008 año
40.944
-0.955
-2.28%
1 ene 2009 año
40.466
-0.478
-1.17%
1 ene 2010 año
41.366
+0.901
2.23%
1 ene 2011 año
40.123
-1.243
-3.0%
1 ene 2012 año
39.933
-0.19
-0.47%
1 ene 2013 año
39.885
-0.048
-0.12%
1 ene 2014 año
39.53
-0.355
-0.89%
Ranking de los países por los datos estadísticos actuales


Comentarios: