29
/es/
es
AIzaSyAYiBZKx7MnpbEhh9jyipgxe19OcubqV5w
April 1, 2024
55377
Pre-demographic dividend
PRE
false
2
1
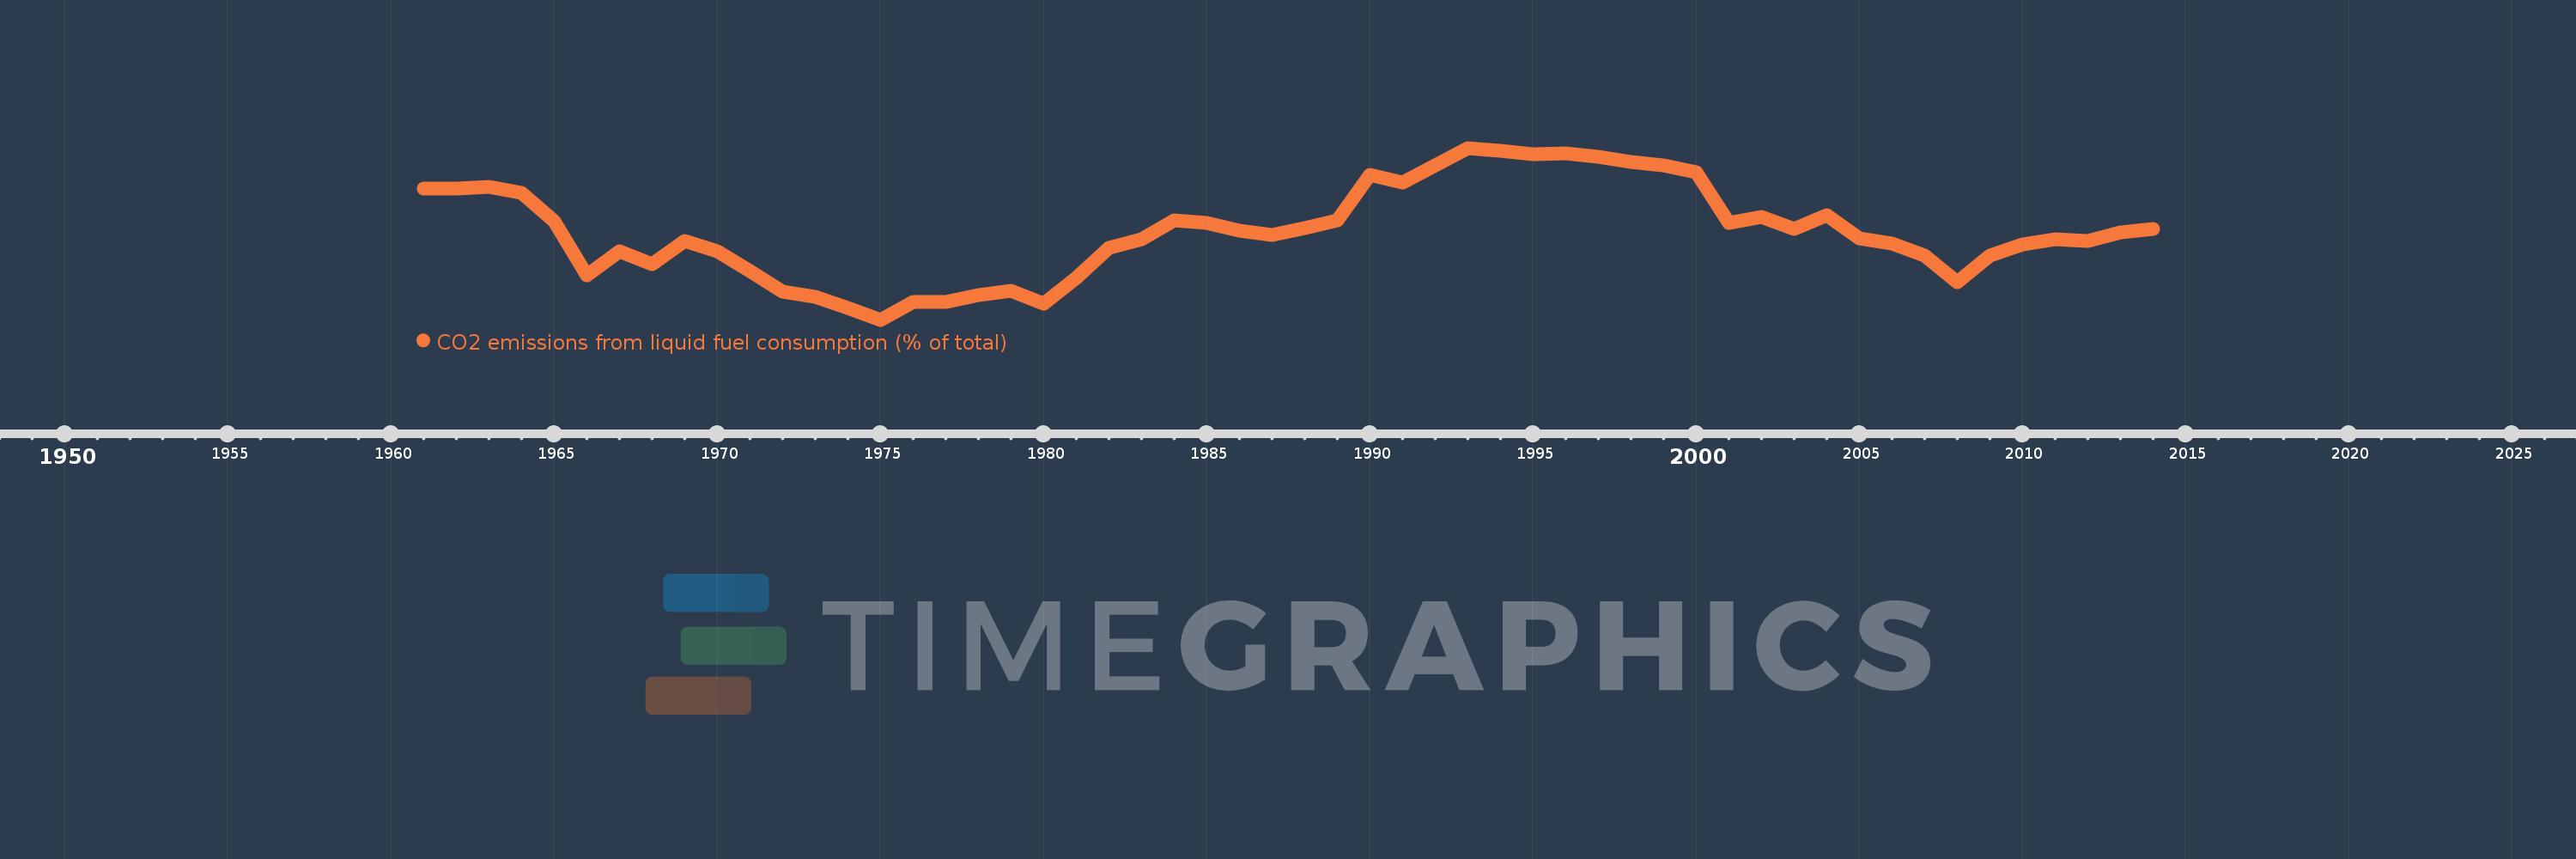
CO2 emissions from liquid fuel consumption (% of total)
2014,2013,2012,2011,2010,2009,2008,2007,2006,2005,2004,2003,2002,2001,2000,1999,1998,1997,1996,1995,1994,1993,1992,1991,1990,1989,1988,1987,1986,1985,1984,1983,1982,1981,1980,1979,1978,1977,1976,1975,1974,1973,1972,1971,1970,1969,1968,1967,1966,1965,1964,1963,1962,1961
Estas estadísticas en otros países:
AfghanistanAlbaniaAlgeriaAndorraAngolaAntigua and BarbudaArab WorldArgentinaArmeniaArubaAustraliaAustriaAzerbaijanBahamas, TheBahrainBangladeshBarbadosBelarusBelgiumBelizeBeninBermudaBhutanBoliviaBosnia and HerzegovinaBotswanaBrazilBritish Virgin IslandsBrunei DarussalamBulgariaBurkina FasoBurundiCabo VerdeCambodiaCameroonCanadaCaribbean small statesCayman IslandsCentral African RepublicCentral Europe and the BalticsChadChileChinaColombiaComorosCongo, Dem. Rep.Congo, Rep.Costa RicaCote d'IvoireCroatiaCubaCuracaoCyprusCzech RepublicDenmarkDjiboutiDominicaDominican RepublicEarly-demographic dividendEast Asia & PacificEast Asia & Pacific (excluding high income)East Asia & Pacific (IDA & IBRD countries)EcuadorEgypt, Arab Rep.El SalvadorEquatorial GuineaEritreaEstoniaEthiopiaEuro areaEurope & Central AsiaEurope & Central Asia (excluding high income)Europe & Central Asia (IDA & IBRD countries)European UnionFaroe IslandsFijiFinlandFragile and conflict affected situationsFranceFrench PolynesiaGabonGambia, TheGeorgiaGermanyGhanaGibraltarGreeceGreenlandGrenadaGuatemalaGuineaGuinea-BissauGuyanaHaitiHeavily indebted poor countries (HIPC)High incomeHondurasHong Kong SAR, ChinaHungaryIBRD onlyIcelandIDA & IBRD totalIDA blendIDA onlyIDA totalIndiaIndonesiaIran, Islamic Rep.IraqIrelandIsraelItalyJamaicaJapanJordanKazakhstanKenyaKiribatiKorea, Dem. People’s Rep.Korea, Rep.KuwaitKyrgyz RepublicLao PDRLate-demographic dividendLatin America & Caribbean Latin America & Caribbean (excluding high income)Latin America & the Caribbean (IDA & IBRD countries)LatviaLeast developed countries: UN classificationLebanonLesothoLiberiaLibyaLiechtensteinLithuaniaLow & middle incomeLow incomeLower middle incomeLuxembourgMacao SAR, ChinaMacedonia, FYRMadagascarMalawiMalaysiaMaldivesMaliMaltaMarshall IslandsMauritaniaMauritiusMexicoMicronesia, Fed. Sts.Middle East & North AfricaMiddle East & North Africa (excluding high income)Middle East & North Africa (IDA & IBRD countries)Middle incomeMoldovaMongoliaMontenegroMoroccoMozambiqueMyanmarNamibiaNauruNepalNetherlandsNew CaledoniaNew ZealandNicaraguaNigerNigeriaNorth AmericaNorwayOECD membersOmanOther small statesPacific island small statesPakistanPalauPanamaPapua New GuineaParaguayPeruPhilippinesPolandPortugalPost-demographic dividendPre-demographic dividendQatarRomaniaRussian FederationRwandaSamoaSao Tome and PrincipeSaudi ArabiaSenegalSerbiaSeychellesSierra LeoneSingaporeSint Maarten (Dutch part)Slovak RepublicSloveniaSmall statesSolomon IslandsSomaliaSouth AfricaSouth AsiaSouth Asia (IDA & IBRD)South SudanSpainSri LankaSt. Kitts and NevisSt. LuciaSt. Vincent and the GrenadinesSub-Saharan Africa Sub-Saharan Africa (excluding high income)Sub-Saharan Africa (IDA & IBRD countries)SudanSurinameSwazilandSwedenSwitzerlandSyrian Arab RepublicTajikistanTanzaniaThailandTimor-LesteTogoTongaTrinidad and TobagoTunisiaTurkeyTurkmenistanTurks and Caicos IslandsUgandaUkraineUnited Arab EmiratesUnited KingdomUnited StatesUpper middle incomeUruguayUzbekistanVanuatuVenezuela, RBVietnamWest Bank and GazaWorldYemen, Rep.ZambiaZimbabwe línea de tiempo (timeline):
En esta escala de tiempo se presenta un gráfico de 1961 y 2014 de Pre-demographic dividend. Los datos de 1960 están ausentes. El número de observaciones reales por fecha: 54.
Fuente (nombre):
Indicadores del desarrollo mundial
Fuente (organización):
Carbon Dioxide Information Analysis Center, Environmental Sciences Division, Oak Ridge National Laboratory, Tennessee, United States.
Categorías:
Climate Change, Environment
Se ha actualizado:
23 abr 2017 año
Los indicadores de los cambios de valor en los últimos años
Mínimo:
41.333
1 ene 1975 año
Máximo:
85.474
1 ene 1993 año
A la fecha de observación
Valor
Cambio absoluto
El cambio con respecto al valor anterior
1 ene 1961 año
75.032
+75.032
0.0%
1 ene 1962 año
75.066
+0.034
0.05%
1 ene 1963 año
75.438
+0.372
0.5%
1 ene 1964 año
73.891
-1.547
-2.05%
1 ene 1965 año
66.615
-7.276
-9.85%
1 ene 1966 año
52.67
-13.945
-20.93%
1 ene 1967 año
58.912
+6.242
11.85%
1 ene 1968 año
55.509
-3.402
-5.77%
1 ene 1969 año
61.477
+5.968
10.75%
1 ene 1970 año
58.829
-2.648
-4.31%
1 ene 1971 año
53.834
-4.995
-8.49%
1 ene 1972 año
48.586
-5.247
-9.75%
1 ene 1973 año
47.321
-1.266
-2.6%
1 ene 1974 año
44.309
-3.012
-6.36%
1 ene 1975 año
41.333
-2.976
-6.72%
1 ene 1976 año
45.94
+4.608
11.15%
1 ene 1977 año
45.81
-0.13
-0.28%
1 ene 1978 año
47.706
+1.896
4.14%
1 ene 1979 año
48.74
+1.034
2.17%
1 ene 1980 año
45.42
-3.32
-6.81%
1 ene 1981 año
52.113
+6.693
14.74%
1 ene 1982 año
59.822
+7.708
14.79%
1 ene 1983 año
62.068
+2.246
3.75%
1 ene 1984 año
66.837
+4.769
7.68%
1 ene 1985 año
66.196
-0.641
-0.96%
1 ene 1986 año
64.249
-1.947
-2.94%
1 ene 1987 año
63.047
-1.202
-1.87%
1 ene 1988 año
64.847
+1.799
2.85%
1 ene 1989 año
66.855
+2.008
3.1%
1 ene 1990 año
78.635
+11.78
17.62%
1 ene 1991 año
76.586
-2.048
-2.61%
1 ene 1992 año
81.075
+4.489
5.86%
1 ene 1993 año
85.474
+4.398
5.42%
1 ene 1994 año
84.784
-0.689
-0.81%
1 ene 1995 año
83.795
-0.989
-1.17%
1 ene 1996 año
84.136
+0.341
0.41%
1 ene 1997 año
83.216
-0.92
-1.09%
1 ene 1998 año
81.815
-1.401
-1.68%
1 ene 1999 año
80.955
-0.859
-1.05%
1 ene 2000 año
79.121
-1.834
-2.27%
1 ene 2001 año
66.222
-12.899
-16.3%
1 ene 2002 año
67.647
+1.425
2.15%
1 ene 2003 año
64.694
-2.953
-4.37%
1 ene 2004 año
68.254
+3.56
5.5%
1 ene 2005 año
62.188
-6.067
-8.89%
1 ene 2006 año
60.998
-1.189
-1.91%
1 ene 2007 año
57.822
-3.176
-5.21%
1 ene 2008 año
50.877
-6.945
-12.01%
1 ene 2009 año
57.786
+6.909
13.58%
1 ene 2010 año
60.736
+2.949
5.1%
1 ene 2011 año
62.066
+1.331
2.19%
1 ene 2012 año
61.551
-0.515
-0.83%
1 ene 2013 año
63.82
+2.269
3.69%
1 ene 2014 año
64.697
+0.876
1.37%
Ranking de los países por los datos estadísticos actuales


Comentarios: