29
/es/
es
AIzaSyAYiBZKx7MnpbEhh9jyipgxe19OcubqV5w
April 1, 2024
72954
Australia
AUS
true
2
1
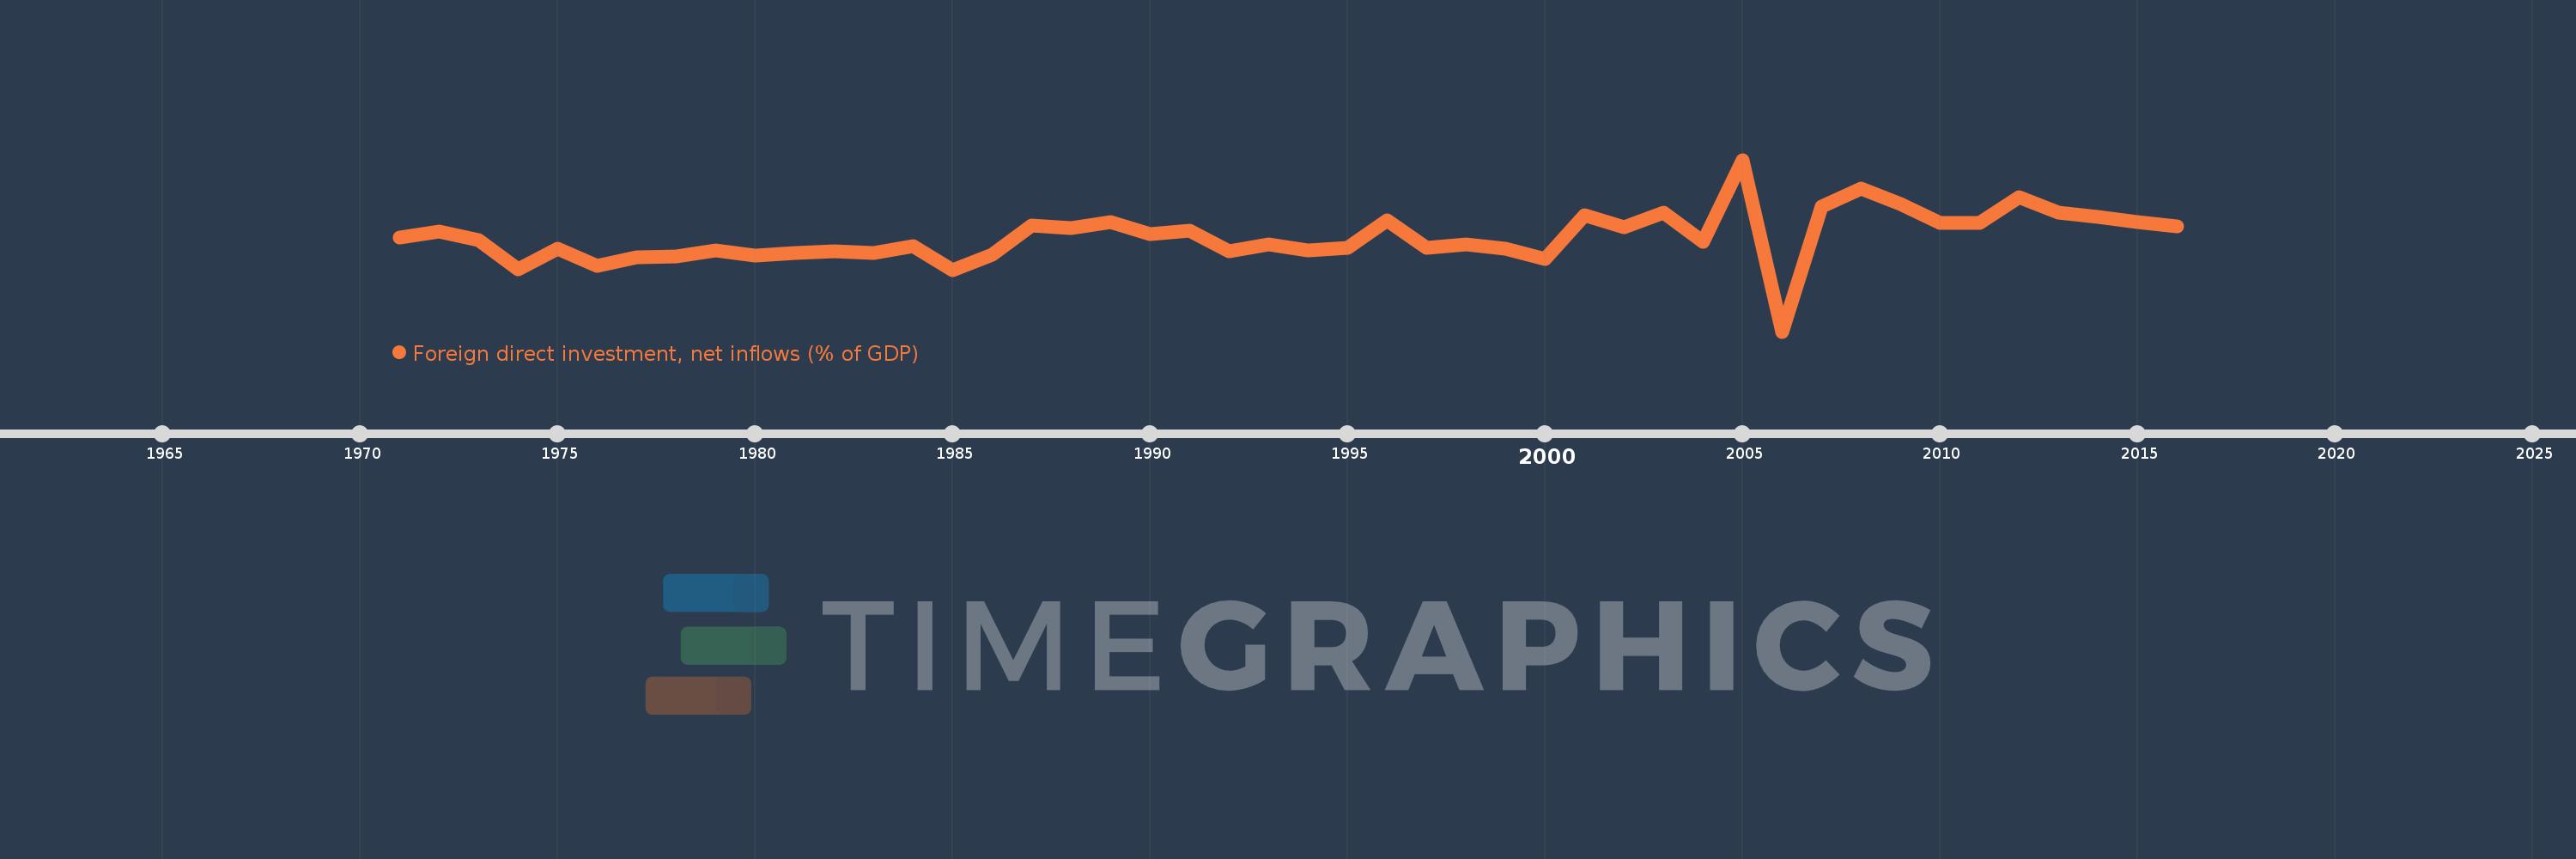
Foreign direct investment, net inflows (% of GDP)
2016,2015,2014,2013,2012,2011,2010,2009,2008,2007,2006,2005,2004,2003,2002,2001,2000,1999,1998,1997,1996,1995,1994,1993,1992,1991,1990,1989,1988,1987,1986,1985,1984,1983,1982,1981,1980,1979,1978,1977,1976,1975,1974,1973,1972,1971
Estas estadísticas en otros países:
AfghanistanAlbaniaAlgeriaAngolaAntigua and BarbudaArab WorldArgentinaArmeniaArubaAustraliaAustriaAzerbaijanBahamas, TheBahrainBangladeshBarbadosBelarusBelgiumBelizeBeninBermudaBhutanBoliviaBosnia and HerzegovinaBotswanaBrazilBrunei DarussalamBulgariaBurkina FasoBurundiCabo VerdeCambodiaCameroonCanadaCaribbean small statesCayman IslandsCentral African RepublicCentral Europe and the BalticsChadChileChinaColombiaComorosCongo, Dem. Rep.Congo, Rep.Costa RicaCote d'IvoireCroatiaCyprusCzech RepublicDenmarkDjiboutiDominicaDominican RepublicEarly-demographic dividendEast Asia & PacificEast Asia & Pacific (excluding high income)East Asia & Pacific (IDA & IBRD countries)EcuadorEgypt, Arab Rep.El SalvadorEquatorial GuineaEritreaEstoniaEthiopiaEuro areaEurope & Central AsiaEurope & Central Asia (excluding high income)Europe & Central Asia (IDA & IBRD countries)European UnionFijiFinlandFragile and conflict affected situationsFranceFrench PolynesiaGabonGambia, TheGeorgiaGermanyGhanaGreeceGrenadaGuatemalaGuineaGuinea-BissauGuyanaHaitiHeavily indebted poor countries (HIPC)High incomeHondurasHong Kong SAR, ChinaHungaryIBRD onlyIcelandIDA & IBRD totalIDA blendIDA onlyIDA totalIndiaIndonesiaIran, Islamic Rep.IraqIrelandIsraelItalyJamaicaJapanJordanKazakhstanKenyaKiribatiKorea, Rep.KosovoKuwaitKyrgyz RepublicLao PDRLate-demographic dividendLatin America & Caribbean Latin America & Caribbean (excluding high income)Latin America & the Caribbean (IDA & IBRD countries)LatviaLeast developed countries: UN classificationLebanonLesothoLiberiaLibyaLithuaniaLow & middle incomeLow incomeLower middle incomeLuxembourgMacao SAR, ChinaMacedonia, FYRMadagascarMalawiMalaysiaMaldivesMaliMaltaMarshall IslandsMauritaniaMauritiusMexicoMicronesia, Fed. Sts.Middle East & North AfricaMiddle East & North Africa (excluding high income)Middle East & North Africa (IDA & IBRD countries)Middle incomeMoldovaMongoliaMontenegroMoroccoMozambiqueMyanmarNamibiaNauruNepalNetherlandsNew CaledoniaNew ZealandNicaraguaNigerNigeriaNorth AmericaNorwayOECD membersOmanOther small statesPacific island small statesPakistanPalauPanamaPapua New GuineaParaguayPeruPhilippinesPolandPortugalPost-demographic dividendPre-demographic dividendQatarRomaniaRussian FederationRwandaSamoaSao Tome and PrincipeSaudi ArabiaSenegalSerbiaSeychellesSierra LeoneSingaporeSlovak RepublicSloveniaSmall statesSolomon IslandsSomaliaSouth AfricaSouth AsiaSouth Asia (IDA & IBRD)South SudanSpainSri LankaSt. Kitts and NevisSt. LuciaSt. Vincent and the GrenadinesSub-Saharan Africa Sub-Saharan Africa (excluding high income)Sub-Saharan Africa (IDA & IBRD countries)SudanSurinameSwazilandSwedenSwitzerlandSyrian Arab RepublicTajikistanTanzaniaThailandTimor-LesteTogoTongaTrinidad and TobagoTunisiaTurkeyTurkmenistanTuvaluUgandaUkraineUnited Arab EmiratesUnited KingdomUnited StatesUpper middle incomeUruguayUzbekistanVanuatuVenezuela, RBVietnamWest Bank and GazaWorldYemen, Rep.ZambiaZimbabwe línea de tiempo (timeline):
En esta escala de tiempo se presenta un gráfico de 1971 y 2016 de Australia. Los datos de 1970 están ausentes. El número de observaciones reales por fecha: 46.
Fuente (nombre):
Indicadores del desarrollo mundial
Fuente (organización):
International Monetary Fund, International Financial Statistics and Balance of Payments databases, World Bank, International Debt Statistics, and World Bank and OECD GDP estimates.
Categorías:
Economy & Growth, Financial Sector, Climate Change
Se ha actualizado:
23 abr 2017 año
Los indicadores de los cambios de valor en los últimos años
Mínimo:
-3.621
1 ene 2006 año
Máximo:
7.003
1 ene 2005 año
A la fecha de observación
Valor
Cambio absoluto
El cambio con respecto al valor anterior
1 ene 1971 año
2.178
+2.178
0.0%
1 ene 1972 año
2.546
+0.368
16.92%
1 ene 1973 año
2.029
-0.518
-20.32%
1 ene 1974 año
0.231
-1.798
-88.6%
1 ene 1975 año
1.501
+1.269
548.9%
1 ene 1976 año
0.469
-1.032
-68.76%
1 ene 1977 año
0.995
+0.526
112.21%
1 ene 1978 año
1.035
+0.04
4.01%
1 ene 1979 año
1.419
+0.384
37.15%
1 ene 1980 año
1.106
-0.313
-22.07%
1 ene 1981 año
1.249
+0.144
12.98%
1 ene 1982 año
1.329
+0.08
6.4%
1 ene 1983 año
1.22
-0.109
-8.21%
1 ene 1984 año
1.687
+0.467
38.28%
1 ene 1985 año
0.194
-1.494
-88.51%
1 ene 1986 año
1.145
+0.951
490.4%
1 ene 1987 año
2.932
+1.787
156.14%
1 ene 1988 año
2.784
-0.148
-5.06%
1 ene 1989 año
3.129
+0.345
12.4%
1 ene 1990 año
2.424
-0.705
-22.53%
1 ene 1991 año
2.608
+0.184
7.61%
1 ene 1992 año
1.325
-1.284
-49.22%
1 ene 1993 año
1.752
+0.428
32.29%
1 ene 1994 año
1.384
-0.368
-21.0%
1 ene 1995 año
1.549
+0.165
11.91%
1 ene 1996 año
3.269
+1.719
110.99%
1 ene 1997 año
1.54
-1.728
-52.88%
1 ene 1998 año
1.752
+0.212
13.75%
1 ene 1999 año
1.492
-0.26
-14.85%
1 ene 2000 año
0.852
-0.64
-42.9%
1 ene 2001 año
3.589
+2.737
321.31%
1 ene 2002 año
2.832
-0.757
-21.1%
1 ene 2003 año
3.718
+0.886
31.3%
1 ene 2004 año
1.927
-1.791
-48.18%
1 ene 2005 año
7.003
+5.076
263.47%
1 ene 2006 año
-3.621
-10.624
-151.7%
1 ene 2007 año
4.09
+7.711
-212.98%
1 ene 2008 año
5.21
+1.119
27.36%
1 ene 2009 año
4.282
-0.927
-17.8%
1 ene 2010 año
3.096
-1.187
-27.71%
1 ene 2011 año
3.083
-0.013
-0.42%
1 ene 2012 año
4.716
+1.634
53.0%
1 ene 2013 año
3.743
-0.973
-20.64%
1 ene 2014 año
3.453
-0.291
-7.76%
1 ene 2015 año
3.161
-0.292
-8.45%
1 ene 2016 año
2.885
-0.275
-8.71%
Ranking de los países por los datos estadísticos actuales


Comentarios: