29
/es/
es
AIzaSyAYiBZKx7MnpbEhh9jyipgxe19OcubqV5w
April 1, 2024
225882
Portugal
PRT
true
2
1
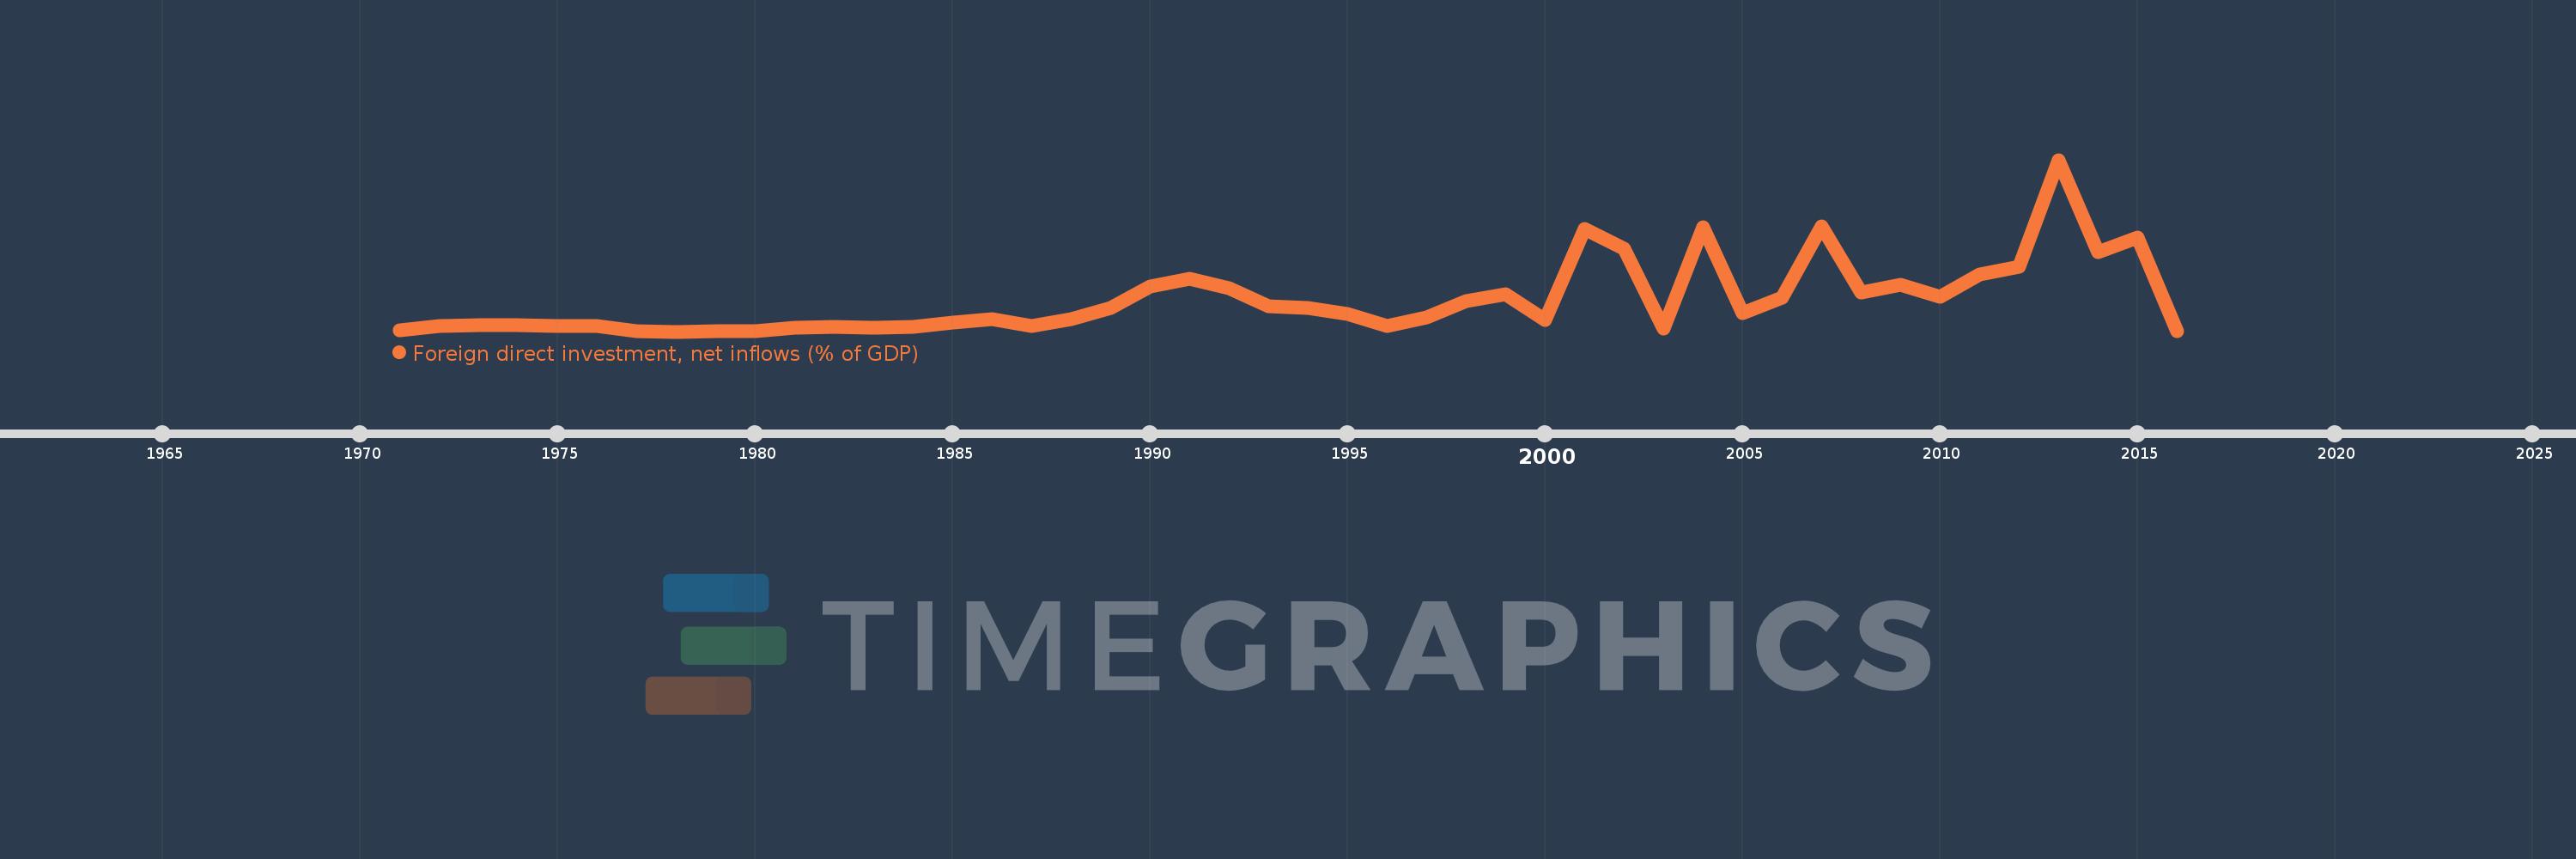
Foreign direct investment, net inflows (% of GDP)
2016,2015,2014,2013,2012,2011,2010,2009,2008,2007,2006,2005,2004,2003,2002,2001,2000,1999,1998,1997,1996,1995,1994,1993,1992,1991,1990,1989,1988,1987,1986,1985,1984,1983,1982,1981,1980,1979,1978,1977,1976,1975,1974,1973,1972,1971
Estas estadísticas en otros países:
AfghanistanAlbaniaAlgeriaAngolaAntigua and BarbudaArab WorldArgentinaArmeniaArubaAustraliaAustriaAzerbaijanBahamas, TheBahrainBangladeshBarbadosBelarusBelgiumBelizeBeninBermudaBhutanBoliviaBosnia and HerzegovinaBotswanaBrazilBrunei DarussalamBulgariaBurkina FasoBurundiCabo VerdeCambodiaCameroonCanadaCaribbean small statesCayman IslandsCentral African RepublicCentral Europe and the BalticsChadChileChinaColombiaComorosCongo, Dem. Rep.Congo, Rep.Costa RicaCote d'IvoireCroatiaCyprusCzech RepublicDenmarkDjiboutiDominicaDominican RepublicEarly-demographic dividendEast Asia & PacificEast Asia & Pacific (excluding high income)East Asia & Pacific (IDA & IBRD countries)EcuadorEgypt, Arab Rep.El SalvadorEquatorial GuineaEritreaEstoniaEthiopiaEuro areaEurope & Central AsiaEurope & Central Asia (excluding high income)Europe & Central Asia (IDA & IBRD countries)European UnionFijiFinlandFragile and conflict affected situationsFranceFrench PolynesiaGabonGambia, TheGeorgiaGermanyGhanaGreeceGrenadaGuatemalaGuineaGuinea-BissauGuyanaHaitiHeavily indebted poor countries (HIPC)High incomeHondurasHong Kong SAR, ChinaHungaryIBRD onlyIcelandIDA & IBRD totalIDA blendIDA onlyIDA totalIndiaIndonesiaIran, Islamic Rep.IraqIrelandIsraelItalyJamaicaJapanJordanKazakhstanKenyaKiribatiKorea, Rep.KosovoKuwaitKyrgyz RepublicLao PDRLate-demographic dividendLatin America & Caribbean Latin America & Caribbean (excluding high income)Latin America & the Caribbean (IDA & IBRD countries)LatviaLeast developed countries: UN classificationLebanonLesothoLiberiaLibyaLithuaniaLow & middle incomeLow incomeLower middle incomeLuxembourgMacao SAR, ChinaMacedonia, FYRMadagascarMalawiMalaysiaMaldivesMaliMaltaMarshall IslandsMauritaniaMauritiusMexicoMicronesia, Fed. Sts.Middle East & North AfricaMiddle East & North Africa (excluding high income)Middle East & North Africa (IDA & IBRD countries)Middle incomeMoldovaMongoliaMontenegroMoroccoMozambiqueMyanmarNamibiaNauruNepalNetherlandsNew CaledoniaNew ZealandNicaraguaNigerNigeriaNorth AmericaNorwayOECD membersOmanOther small statesPacific island small statesPakistanPalauPanamaPapua New GuineaParaguayPeruPhilippinesPolandPortugalPost-demographic dividendPre-demographic dividendQatarRomaniaRussian FederationRwandaSamoaSao Tome and PrincipeSaudi ArabiaSenegalSerbiaSeychellesSierra LeoneSingaporeSlovak RepublicSloveniaSmall statesSolomon IslandsSomaliaSouth AfricaSouth AsiaSouth Asia (IDA & IBRD)South SudanSpainSri LankaSt. Kitts and NevisSt. LuciaSt. Vincent and the GrenadinesSub-Saharan Africa Sub-Saharan Africa (excluding high income)Sub-Saharan Africa (IDA & IBRD countries)SudanSurinameSwazilandSwedenSwitzerlandSyrian Arab RepublicTajikistanTanzaniaThailandTimor-LesteTogoTongaTrinidad and TobagoTunisiaTurkeyTurkmenistanTuvaluUgandaUkraineUnited Arab EmiratesUnited KingdomUnited StatesUpper middle incomeUruguayUzbekistanVanuatuVenezuela, RBVietnamWest Bank and GazaWorldYemen, Rep.ZambiaZimbabwe línea de tiempo (timeline):
En esta escala de tiempo se presenta un gráfico de 1971 y 2016 de Portugal. Los datos de 1970 están ausentes. El número de observaciones reales por fecha: 46.
Fuente (nombre):
Indicadores del desarrollo mundial
Fuente (organización):
International Monetary Fund, International Financial Statistics and Balance of Payments databases, World Bank, International Debt Statistics, and World Bank and OECD GDP estimates.
Categorías:
Economy & Growth, Financial Sector, Climate Change
Se ha actualizado:
23 abr 2017 año
Los indicadores de los cambios de valor en los últimos años
Mínimo:
0.27
1 ene 1978 año
Máximo:
10.157
1 ene 2013 año
A la fecha de observación
Valor
Cambio absoluto
El cambio con respecto al valor anterior
1 ene 1971 año
0.356
+0.356
0.0%
1 ene 1972 año
0.609
+0.252
70.75%
1 ene 1973 año
0.649
+0.041
6.73%
1 ene 1974 año
0.629
-0.02
-3.08%
1 ene 1975 año
0.605
-0.024
-3.85%
1 ene 1976 año
0.596
-0.009
-1.5%
1 ene 1977 año
0.31
-0.286
-48.03%
1 ene 1978 año
0.27
-0.04
-12.82%
1 ene 1979 año
0.281
+0.011
4.01%
1 ene 1980 año
0.294
+0.013
4.68%
1 ene 1981 año
0.477
+0.183
62.21%
1 ene 1982 año
0.546
+0.069
14.37%
1 ene 1983 año
0.472
-0.074
-13.53%
1 ene 1984 año
0.539
+0.067
14.25%
1 ene 1985 año
0.786
+0.247
45.82%
1 ene 1986 año
1.011
+0.225
28.57%
1 ene 1987 año
0.615
-0.396
-39.18%
1 ene 1988 año
0.967
+0.352
57.31%
1 ene 1989 año
1.635
+0.669
69.16%
1 ene 1990 año
2.866
+1.231
75.26%
1 ene 1991 año
3.315
+0.449
15.68%
1 ene 1992 año
2.744
-0.572
-17.25%
1 ene 1993 año
1.741
-1.003
-36.54%
1 ene 1994 año
1.614
-0.127
-7.28%
1 ene 1995 año
1.274
-0.341
-21.11%
1 ene 1996 año
0.579
-0.694
-54.5%
1 ene 1997 año
1.098
+0.519
89.54%
1 ene 1998 año
2.013
+0.915
83.31%
1 ene 1999 año
2.423
+0.41
20.35%
1 ene 2000 año
0.916
-1.507
-62.2%
1 ene 2001 año
6.162
+5.246
572.72%
1 ene 2002 año
5.033
-1.129
-18.32%
1 ene 2003 año
0.444
-4.589
-91.18%
1 ene 2004 año
6.266
+5.822
1.31 mil%
1 ene 2005 año
1.32
-4.946
-78.93%
1 ene 2006 año
2.245
+0.925
70.07%
1 ene 2007 año
6.328
+4.084
181.92%
1 ene 2008 año
2.509
-3.819
-60.35%
1 ene 2009 año
2.985
+0.476
18.97%
1 ene 2010 año
2.289
-0.696
-23.33%
1 ene 2011 año
3.548
+1.259
55.02%
1 ene 2012 año
4.009
+0.461
12.99%
1 ene 2013 año
10.157
+6.148
153.34%
1 ene 2014 año
4.837
-5.32
-52.38%
1 ene 2015 año
5.7
+0.863
17.83%
1 ene 2016 año
0.318
-5.382
-94.42%
Ranking de los países por los datos estadísticos actuales


Comentarios: