29
/es/
es
AIzaSyAYiBZKx7MnpbEhh9jyipgxe19OcubqV5w
April 1, 2024
285879
Zambia
ZMB
true
2
1
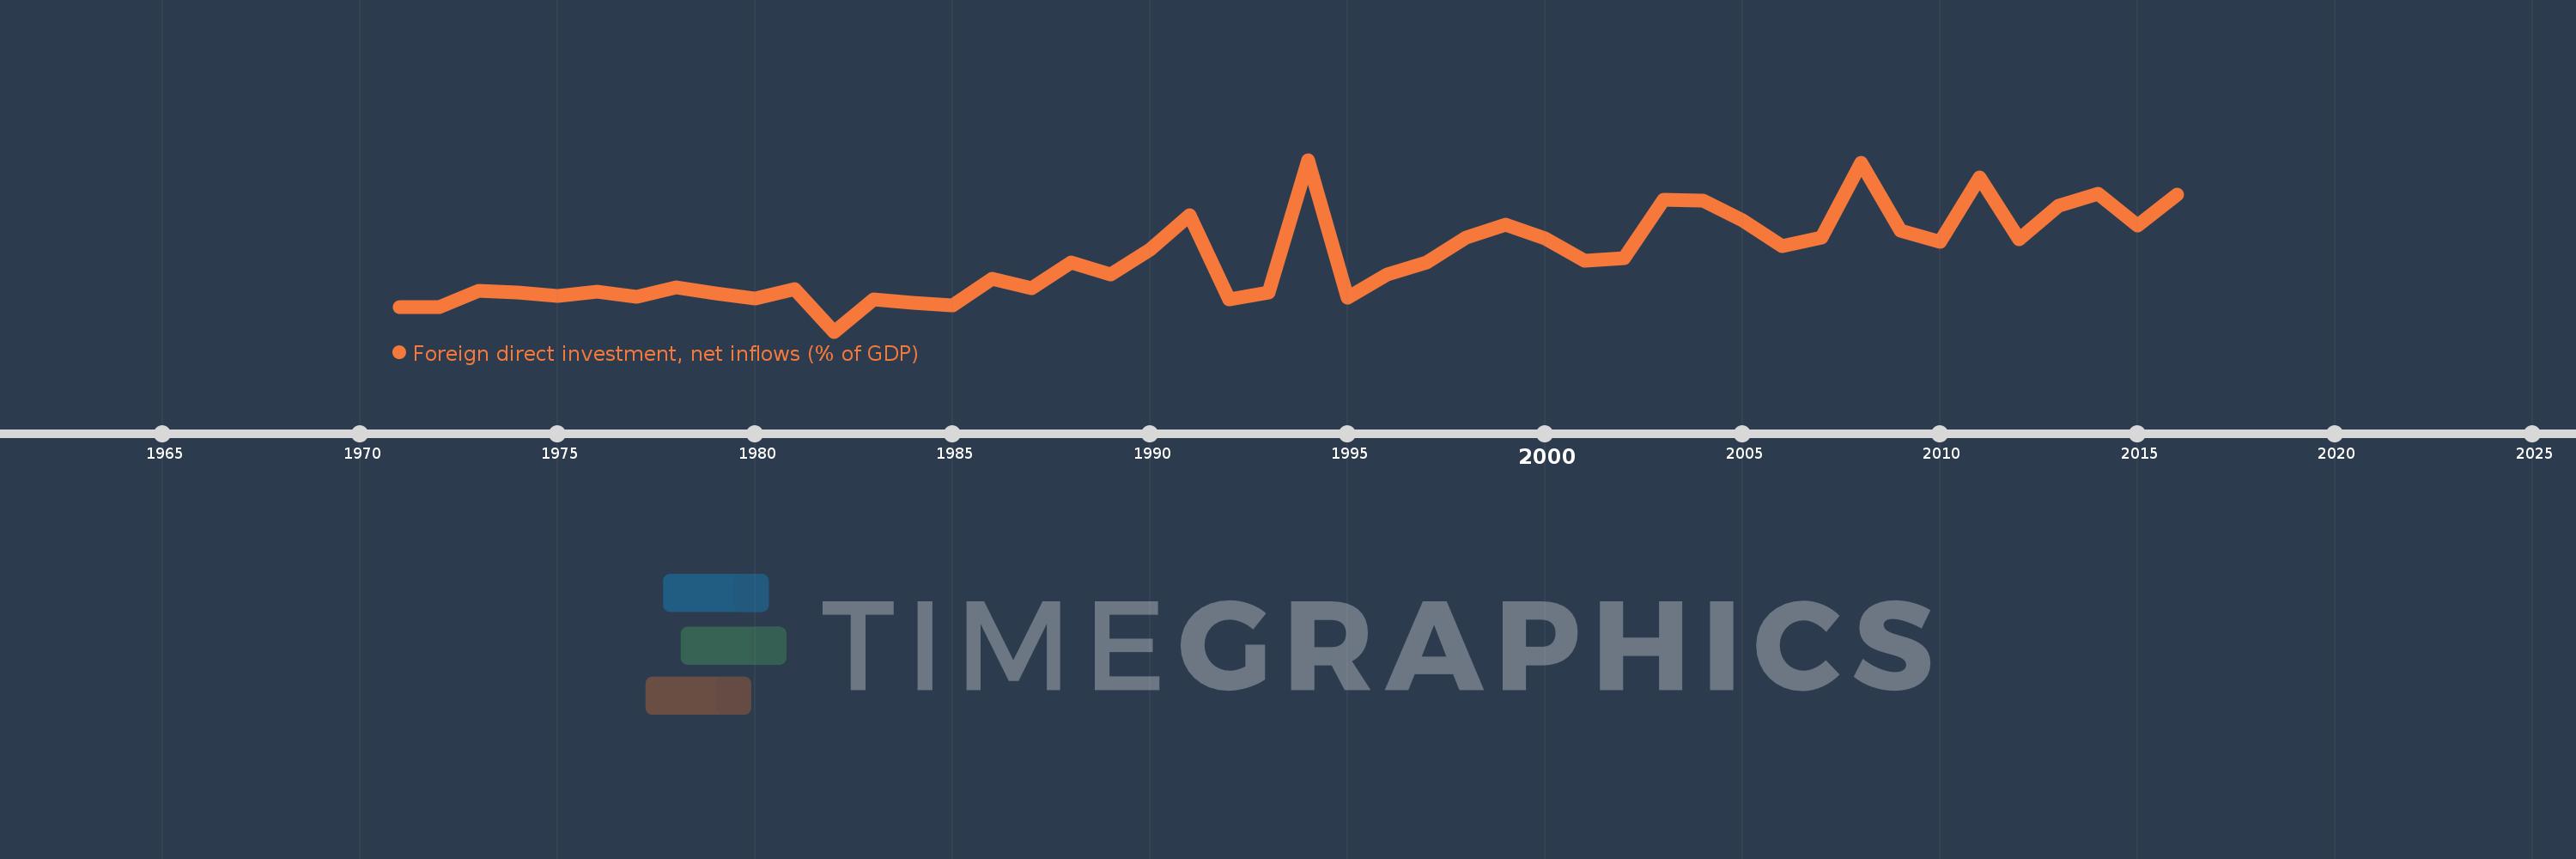
Foreign direct investment, net inflows (% of GDP)
2016,2015,2014,2013,2012,2011,2010,2009,2008,2007,2006,2005,2004,2003,2002,2001,2000,1999,1998,1997,1996,1995,1994,1993,1992,1991,1990,1989,1988,1987,1986,1985,1984,1983,1982,1981,1980,1979,1978,1977,1976,1975,1974,1973,1972,1971
Estas estadísticas en otros países:
AfghanistanAlbaniaAlgeriaAngolaAntigua and BarbudaArab WorldArgentinaArmeniaArubaAustraliaAustriaAzerbaijanBahamas, TheBahrainBangladeshBarbadosBelarusBelgiumBelizeBeninBermudaBhutanBoliviaBosnia and HerzegovinaBotswanaBrazilBrunei DarussalamBulgariaBurkina FasoBurundiCabo VerdeCambodiaCameroonCanadaCaribbean small statesCayman IslandsCentral African RepublicCentral Europe and the BalticsChadChileChinaColombiaComorosCongo, Dem. Rep.Congo, Rep.Costa RicaCote d'IvoireCroatiaCyprusCzech RepublicDenmarkDjiboutiDominicaDominican RepublicEarly-demographic dividendEast Asia & PacificEast Asia & Pacific (excluding high income)East Asia & Pacific (IDA & IBRD countries)EcuadorEgypt, Arab Rep.El SalvadorEquatorial GuineaEritreaEstoniaEthiopiaEuro areaEurope & Central AsiaEurope & Central Asia (excluding high income)Europe & Central Asia (IDA & IBRD countries)European UnionFijiFinlandFragile and conflict affected situationsFranceFrench PolynesiaGabonGambia, TheGeorgiaGermanyGhanaGreeceGrenadaGuatemalaGuineaGuinea-BissauGuyanaHaitiHeavily indebted poor countries (HIPC)High incomeHondurasHong Kong SAR, ChinaHungaryIBRD onlyIcelandIDA & IBRD totalIDA blendIDA onlyIDA totalIndiaIndonesiaIran, Islamic Rep.IraqIrelandIsraelItalyJamaicaJapanJordanKazakhstanKenyaKiribatiKorea, Rep.KosovoKuwaitKyrgyz RepublicLao PDRLate-demographic dividendLatin America & Caribbean Latin America & Caribbean (excluding high income)Latin America & the Caribbean (IDA & IBRD countries)LatviaLeast developed countries: UN classificationLebanonLesothoLiberiaLibyaLithuaniaLow & middle incomeLow incomeLower middle incomeLuxembourgMacao SAR, ChinaMacedonia, FYRMadagascarMalawiMalaysiaMaldivesMaliMaltaMarshall IslandsMauritaniaMauritiusMexicoMicronesia, Fed. Sts.Middle East & North AfricaMiddle East & North Africa (excluding high income)Middle East & North Africa (IDA & IBRD countries)Middle incomeMoldovaMongoliaMontenegroMoroccoMozambiqueMyanmarNamibiaNauruNepalNetherlandsNew CaledoniaNew ZealandNicaraguaNigerNigeriaNorth AmericaNorwayOECD membersOmanOther small statesPacific island small statesPakistanPalauPanamaPapua New GuineaParaguayPeruPhilippinesPolandPortugalPost-demographic dividendPre-demographic dividendQatarRomaniaRussian FederationRwandaSamoaSao Tome and PrincipeSaudi ArabiaSenegalSerbiaSeychellesSierra LeoneSingaporeSlovak RepublicSloveniaSmall statesSolomon IslandsSomaliaSouth AfricaSouth AsiaSouth Asia (IDA & IBRD)South SudanSpainSri LankaSt. Kitts and NevisSt. LuciaSt. Vincent and the GrenadinesSub-Saharan Africa Sub-Saharan Africa (excluding high income)Sub-Saharan Africa (IDA & IBRD countries)SudanSurinameSwazilandSwedenSwitzerlandSyrian Arab RepublicTajikistanTanzaniaThailandTimor-LesteTogoTongaTrinidad and TobagoTunisiaTurkeyTurkmenistanTuvaluUgandaUkraineUnited Arab EmiratesUnited KingdomUnited StatesUpper middle incomeUruguayUzbekistanVanuatuVenezuela, RBVietnamWest Bank and GazaWorldYemen, Rep.ZambiaZimbabwe línea de tiempo (timeline):
En esta escala de tiempo se presenta un gráfico de 1971 y 2016 de Zambia. Los datos de 1970 están ausentes. El número de observaciones reales por fecha: 46.
Fuente (nombre):
Indicadores del desarrollo mundial
Fuente (organización):
International Monetary Fund, International Financial Statistics and Balance of Payments databases, World Bank, International Debt Statistics, and World Bank and OECD GDP estimates.
Categorías:
Economy & Growth, Financial Sector, Climate Change
Se ha actualizado:
23 abr 2017 año
Los indicadores de los cambios de valor en los últimos años
Mínimo:
-0.992
1 ene 1982 año
Máximo:
9.605
1 ene 1994 año
A la fecha de observación
Valor
Cambio absoluto
El cambio con respecto al valor anterior
1 ene 1971 año
0.522
+0.522
0.0%
1 ene 1972 año
0.499
-0.022
-4.3%
1 ene 1973 año
1.518
+1.019
204.09%
1 ene 1974 año
1.41
-0.107
-7.07%
1 ene 1975 año
1.217
-0.193
-13.7%
1 ene 1976 año
1.451
+0.234
19.21%
1 ene 1977 año
1.129
-0.322
-22.22%
1 ene 1978 año
1.73
+0.602
53.3%
1 ene 1979 año
1.372
-0.358
-20.7%
1 ene 1980 año
1.058
-0.314
-22.85%
1 ene 1981 año
1.611
+0.553
52.21%
1 ene 1982 año
-0.992
-2.603
-161.54%
1 ene 1983 año
0.976
+1.968
-198.46%
1 ene 1984 año
0.799
-0.177
-18.15%
1 ene 1985 año
0.628
-0.171
-21.42%
1 ene 1986 año
2.258
+1.63
259.56%
1 ene 1987 año
1.703
-0.555
-24.57%
1 ene 1988 año
3.282
+1.579
92.74%
1 ene 1989 año
2.512
-0.77
-23.45%
1 ene 1990 año
4.094
+1.582
62.95%
1 ene 1991 año
6.17
+2.076
50.71%
1 ene 1992 año
1.015
-5.155
-83.55%
1 ene 1993 año
1.414
+0.399
39.32%
1 ene 1994 año
9.605
+8.191
579.18%
1 ene 1995 año
1.094
-8.511
-88.61%
1 ene 1996 año
2.548
+1.454
132.92%
1 ene 1997 año
3.255
+0.707
27.76%
1 ene 1998 año
4.82
+1.564
48.05%
1 ene 1999 año
5.597
+0.777
16.13%
1 ene 2000 año
4.759
-0.838
-14.98%
1 ene 2001 año
3.38
-1.379
-28.97%
1 ene 2002 año
3.541
+0.161
4.78%
1 ene 2003 año
7.115
+3.574
100.91%
1 ene 2004 año
7.079
-0.036
-0.51%
1 ene 2005 año
5.852
-1.227
-17.34%
1 ene 2006 año
4.284
-1.568
-26.79%
1 ene 2007 año
4.827
+0.543
12.68%
1 ene 2008 año
9.418
+4.591
95.11%
1 ene 2009 año
5.241
-4.178
-44.36%
1 ene 2010 año
4.533
-0.708
-13.5%
1 ene 2011 año
8.533
+4.0
88.26%
1 ene 2012 año
4.725
-3.808
-44.63%
1 ene 2013 año
6.789
+2.064
43.69%
1 ene 2014 año
7.487
+0.698
10.28%
1 ene 2015 año
5.553
-1.934
-25.83%
1 ene 2016 año
7.482
+1.928
34.72%
Ranking de los países por los datos estadísticos actuales


Comentarios: