29
/es/
es
AIzaSyAYiBZKx7MnpbEhh9jyipgxe19OcubqV5w
April 1, 2024
214291
Norway
NOR
true
2
1
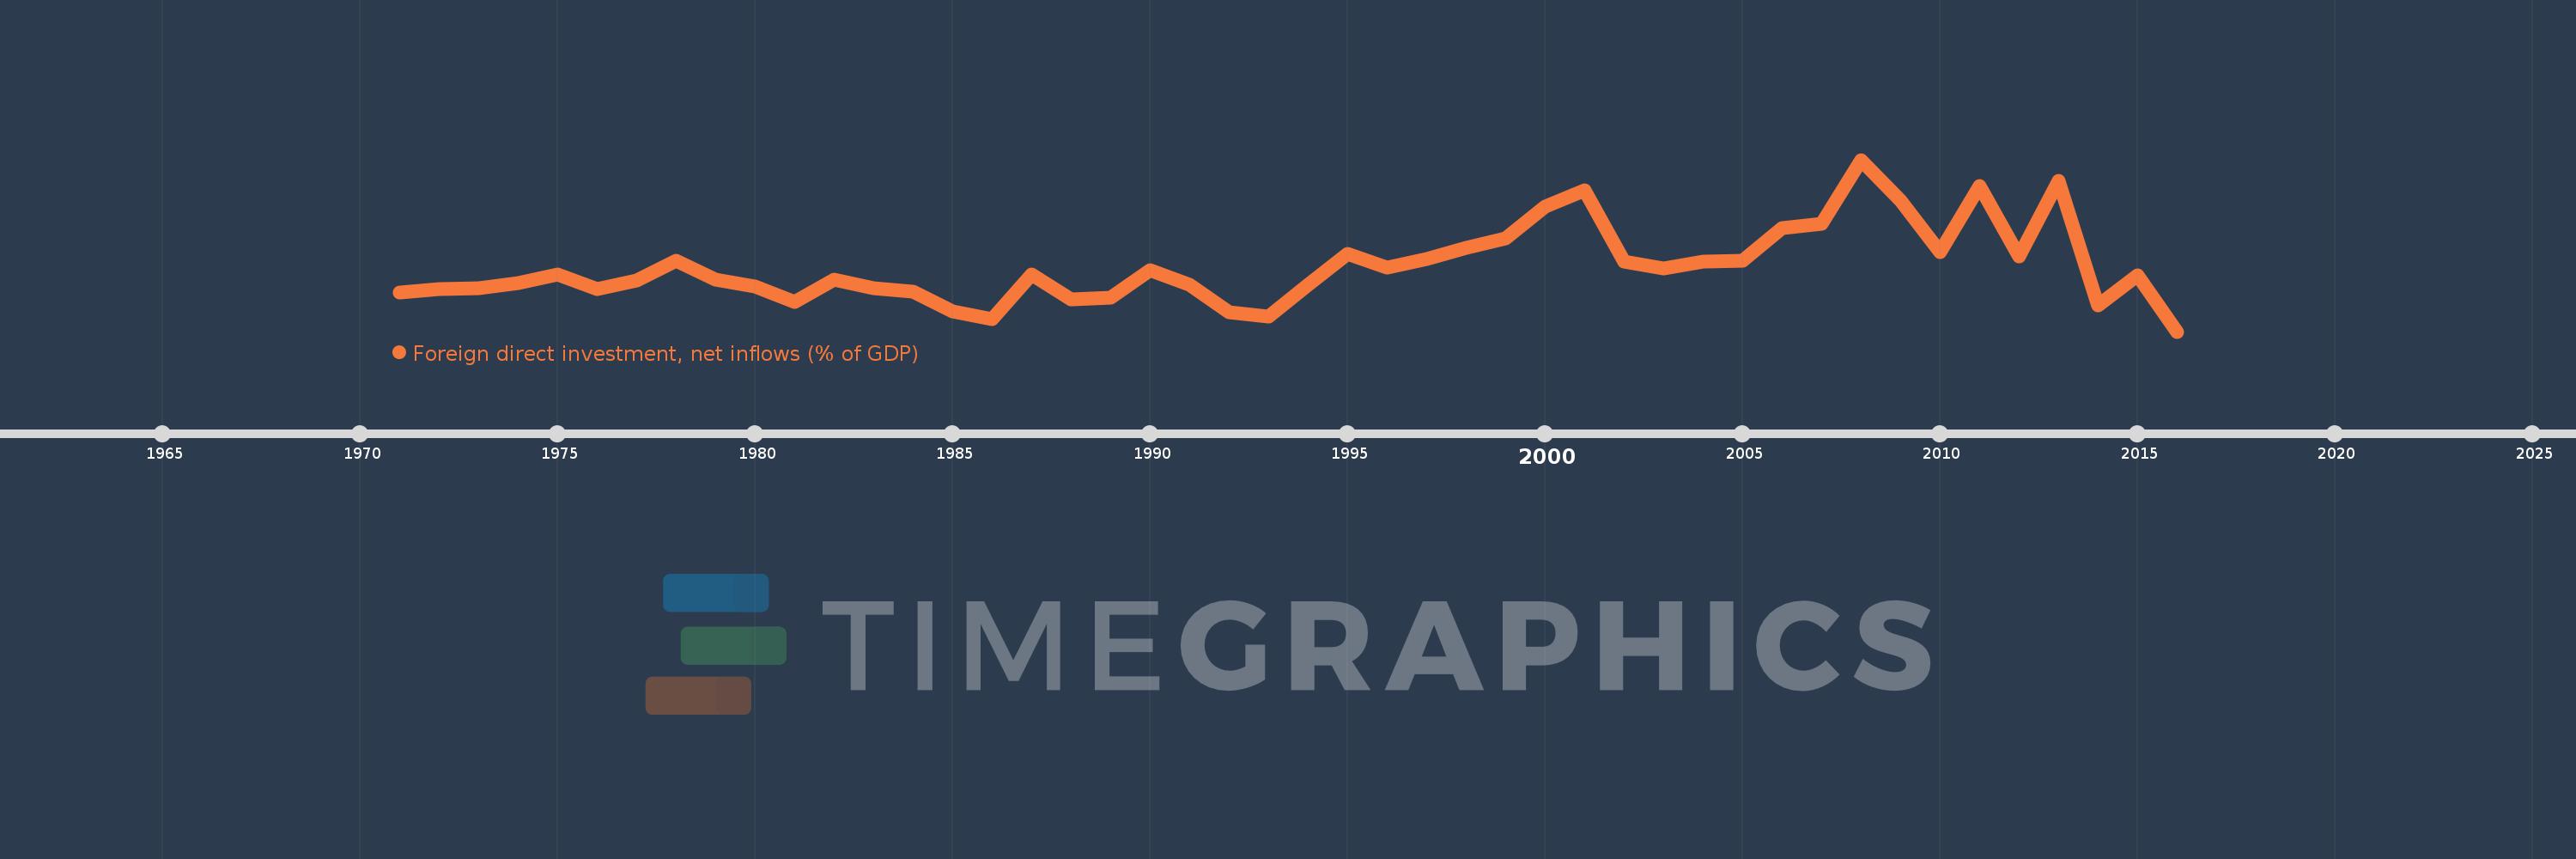
Foreign direct investment, net inflows (% of GDP)
2016,2015,2014,2013,2012,2011,2010,2009,2008,2007,2006,2005,2004,2003,2002,2001,2000,1999,1998,1997,1996,1995,1994,1993,1992,1991,1990,1989,1988,1987,1986,1985,1984,1983,1982,1981,1980,1979,1978,1977,1976,1975,1974,1973,1972,1971
Estas estadísticas en otros países:
AfghanistanAlbaniaAlgeriaAngolaAntigua and BarbudaArab WorldArgentinaArmeniaArubaAustraliaAustriaAzerbaijanBahamas, TheBahrainBangladeshBarbadosBelarusBelgiumBelizeBeninBermudaBhutanBoliviaBosnia and HerzegovinaBotswanaBrazilBrunei DarussalamBulgariaBurkina FasoBurundiCabo VerdeCambodiaCameroonCanadaCaribbean small statesCayman IslandsCentral African RepublicCentral Europe and the BalticsChadChileChinaColombiaComorosCongo, Dem. Rep.Congo, Rep.Costa RicaCote d'IvoireCroatiaCyprusCzech RepublicDenmarkDjiboutiDominicaDominican RepublicEarly-demographic dividendEast Asia & PacificEast Asia & Pacific (excluding high income)East Asia & Pacific (IDA & IBRD countries)EcuadorEgypt, Arab Rep.El SalvadorEquatorial GuineaEritreaEstoniaEthiopiaEuro areaEurope & Central AsiaEurope & Central Asia (excluding high income)Europe & Central Asia (IDA & IBRD countries)European UnionFijiFinlandFragile and conflict affected situationsFranceFrench PolynesiaGabonGambia, TheGeorgiaGermanyGhanaGreeceGrenadaGuatemalaGuineaGuinea-BissauGuyanaHaitiHeavily indebted poor countries (HIPC)High incomeHondurasHong Kong SAR, ChinaHungaryIBRD onlyIcelandIDA & IBRD totalIDA blendIDA onlyIDA totalIndiaIndonesiaIran, Islamic Rep.IraqIrelandIsraelItalyJamaicaJapanJordanKazakhstanKenyaKiribatiKorea, Rep.KosovoKuwaitKyrgyz RepublicLao PDRLate-demographic dividendLatin America & Caribbean Latin America & Caribbean (excluding high income)Latin America & the Caribbean (IDA & IBRD countries)LatviaLeast developed countries: UN classificationLebanonLesothoLiberiaLibyaLithuaniaLow & middle incomeLow incomeLower middle incomeLuxembourgMacao SAR, ChinaMacedonia, FYRMadagascarMalawiMalaysiaMaldivesMaliMaltaMarshall IslandsMauritaniaMauritiusMexicoMicronesia, Fed. Sts.Middle East & North AfricaMiddle East & North Africa (excluding high income)Middle East & North Africa (IDA & IBRD countries)Middle incomeMoldovaMongoliaMontenegroMoroccoMozambiqueMyanmarNamibiaNauruNepalNetherlandsNew CaledoniaNew ZealandNicaraguaNigerNigeriaNorth AmericaNorwayOECD membersOmanOther small statesPacific island small statesPakistanPalauPanamaPapua New GuineaParaguayPeruPhilippinesPolandPortugalPost-demographic dividendPre-demographic dividendQatarRomaniaRussian FederationRwandaSamoaSao Tome and PrincipeSaudi ArabiaSenegalSerbiaSeychellesSierra LeoneSingaporeSlovak RepublicSloveniaSmall statesSolomon IslandsSomaliaSouth AfricaSouth AsiaSouth Asia (IDA & IBRD)South SudanSpainSri LankaSt. Kitts and NevisSt. LuciaSt. Vincent and the GrenadinesSub-Saharan Africa Sub-Saharan Africa (excluding high income)Sub-Saharan Africa (IDA & IBRD countries)SudanSurinameSwazilandSwedenSwitzerlandSyrian Arab RepublicTajikistanTanzaniaThailandTimor-LesteTogoTongaTrinidad and TobagoTunisiaTurkeyTurkmenistanTuvaluUgandaUkraineUnited Arab EmiratesUnited KingdomUnited StatesUpper middle incomeUruguayUzbekistanVanuatuVenezuela, RBVietnamWest Bank and GazaWorldYemen, Rep.ZambiaZimbabwe línea de tiempo (timeline):
En esta escala de tiempo se presenta un gráfico de 1971 y 2016 de Norway. Los datos de 1970 están ausentes. El número de observaciones reales por fecha: 46.
Fuente (nombre):
Indicadores del desarrollo mundial
Fuente (organización):
International Monetary Fund, International Financial Statistics and Balance of Payments databases, World Bank, International Debt Statistics, and World Bank and OECD GDP estimates.
Categorías:
Economy & Growth, Financial Sector, Climate Change
Se ha actualizado:
23 abr 2017 año
Los indicadores de los cambios de valor en los últimos años
Mínimo:
-1.168
1 ene 2016 año
Máximo:
6.188
1 ene 2008 año
A la fecha de observación
Valor
Cambio absoluto
El cambio con respecto al valor anterior
1 ene 1971 año
0.499
+0.499
0.0%
1 ene 1972 año
0.645
+0.145
29.06%
1 ene 1973 año
0.697
+0.052
8.14%
1 ene 1974 año
0.927
+0.23
33.06%
1 ene 1975 año
1.275
+0.347
37.43%
1 ene 1976 año
0.668
-0.606
-47.58%
1 ene 1977 año
1.033
+0.365
54.65%
1 ene 1978 año
1.851
+0.818
79.13%
1 ene 1979 año
1.053
-0.798
-43.12%
1 ene 1980 año
0.755
-0.297
-28.25%
1 ene 1981 año
0.093
-0.663
-87.71%
1 ene 1982 año
1.056
+0.964
1.04 mil%
1 ene 1983 año
0.706
-0.351
-33.21%
1 ene 1984 año
0.533
-0.173
-24.49%
1 ene 1985 año
-0.291
-0.824
-154.58%
1 ene 1986 año
-0.652
-0.361
124.2%
1 ene 1987 año
1.293
+1.945
-298.31%
1 ene 1988 año
0.198
-1.095
-84.67%
1 ene 1989 año
0.274
+0.076
38.31%
1 ene 1990 año
1.48
+1.206
440.02%
1 ene 1991 año
0.837
-0.643
-43.43%
1 ene 1992 año
-0.326
-1.164
-138.96%
1 ene 1993 año
-0.511
-0.184
56.52%
1 ene 1994 año
0.822
+1.333
-261.03%
1 ene 1995 año
2.152
+1.33
161.75%
1 ene 1996 año
1.574
-0.579
-26.88%
1 ene 1997 año
1.944
+0.37
23.52%
1 ene 1998 año
2.408
+0.464
23.88%
1 ene 1999 año
2.824
+0.416
17.26%
1 ene 2000 año
4.175
+1.351
47.84%
1 ene 2001 año
4.864
+0.688
16.48%
1 ene 2002 año
1.833
-3.03
-62.3%
1 ene 2003 año
1.541
-0.292
-15.94%
1 ene 2004 año
1.827
+0.286
18.55%
1 ene 2005 año
1.861
+0.034
1.83%
1 ene 2006 año
3.258
+1.398
75.12%
1 ene 2007 año
3.439
+0.18
5.54%
1 ene 2008 año
6.188
+2.749
79.95%
1 ene 2009 año
4.455
-1.733
-28.01%
1 ene 2010 año
2.235
-2.22
-49.83%
1 ene 2011 año
5.049
+2.814
125.88%
1 ene 2012 año
2.067
-2.982
-59.06%
1 ene 2013 año
5.271
+3.204
155.02%
1 ene 2014 año
-0.053
-5.324
-101.0%
1 ene 2015 año
1.235
+1.287
-2.44 mil%
1 ene 2016 año
-1.168
-2.402
-194.57%
Ranking de los países por los datos estadísticos actuales


Comentarios: