29
/es/
es
AIzaSyAYiBZKx7MnpbEhh9jyipgxe19OcubqV5w
April 1, 2024
257287
Switzerland
CHE
true
2
1
Foreign direct investment, net inflows (% of GDP)
2016,2015,2014,2013,2012,2011,2010,2009,2008,2007,2006,2005,2004,2003,2002,2001,2000,1999,1998,1997,1996,1995,1994,1993,1992,1991,1990,1989,1988,1987,1986,1985,1984
Estas estadísticas en otros países:
AfghanistanAlbaniaAlgeriaAngolaAntigua and BarbudaArab WorldArgentinaArmeniaArubaAustraliaAustriaAzerbaijanBahamas, TheBahrainBangladeshBarbadosBelarusBelgiumBelizeBeninBermudaBhutanBoliviaBosnia and HerzegovinaBotswanaBrazilBrunei DarussalamBulgariaBurkina FasoBurundiCabo VerdeCambodiaCameroonCanadaCaribbean small statesCayman IslandsCentral African RepublicCentral Europe and the BalticsChadChileChinaColombiaComorosCongo, Dem. Rep.Congo, Rep.Costa RicaCote d'IvoireCroatiaCyprusCzech RepublicDenmarkDjiboutiDominicaDominican RepublicEarly-demographic dividendEast Asia & PacificEast Asia & Pacific (excluding high income)East Asia & Pacific (IDA & IBRD countries)EcuadorEgypt, Arab Rep.El SalvadorEquatorial GuineaEritreaEstoniaEthiopiaEuro areaEurope & Central AsiaEurope & Central Asia (excluding high income)Europe & Central Asia (IDA & IBRD countries)European UnionFijiFinlandFragile and conflict affected situationsFranceFrench PolynesiaGabonGambia, TheGeorgiaGermanyGhanaGreeceGrenadaGuatemalaGuineaGuinea-BissauGuyanaHaitiHeavily indebted poor countries (HIPC)High incomeHondurasHong Kong SAR, ChinaHungaryIBRD onlyIcelandIDA & IBRD totalIDA blendIDA onlyIDA totalIndiaIndonesiaIran, Islamic Rep.IraqIrelandIsraelItalyJamaicaJapanJordanKazakhstanKenyaKiribatiKorea, Rep.KosovoKuwaitKyrgyz RepublicLao PDRLate-demographic dividendLatin America & Caribbean Latin America & Caribbean (excluding high income)Latin America & the Caribbean (IDA & IBRD countries)LatviaLeast developed countries: UN classificationLebanonLesothoLiberiaLibyaLithuaniaLow & middle incomeLow incomeLower middle incomeLuxembourgMacao SAR, ChinaMacedonia, FYRMadagascarMalawiMalaysiaMaldivesMaliMaltaMarshall IslandsMauritaniaMauritiusMexicoMicronesia, Fed. Sts.Middle East & North AfricaMiddle East & North Africa (excluding high income)Middle East & North Africa (IDA & IBRD countries)Middle incomeMoldovaMongoliaMontenegroMoroccoMozambiqueMyanmarNamibiaNauruNepalNetherlandsNew CaledoniaNew ZealandNicaraguaNigerNigeriaNorth AmericaNorwayOECD membersOmanOther small statesPacific island small statesPakistanPalauPanamaPapua New GuineaParaguayPeruPhilippinesPolandPortugalPost-demographic dividendPre-demographic dividendQatarRomaniaRussian FederationRwandaSamoaSao Tome and PrincipeSaudi ArabiaSenegalSerbiaSeychellesSierra LeoneSingaporeSlovak RepublicSloveniaSmall statesSolomon IslandsSomaliaSouth AfricaSouth AsiaSouth Asia (IDA & IBRD)South SudanSpainSri LankaSt. Kitts and NevisSt. LuciaSt. Vincent and the GrenadinesSub-Saharan Africa Sub-Saharan Africa (excluding high income)Sub-Saharan Africa (IDA & IBRD countries)SudanSurinameSwazilandSwedenSwitzerlandSyrian Arab RepublicTajikistanTanzaniaThailandTimor-LesteTogoTongaTrinidad and TobagoTunisiaTurkeyTurkmenistanTuvaluUgandaUkraineUnited Arab EmiratesUnited KingdomUnited StatesUpper middle incomeUruguayUzbekistanVanuatuVenezuela, RBVietnamWest Bank and GazaWorldYemen, Rep.ZambiaZimbabwe línea de tiempo (timeline):
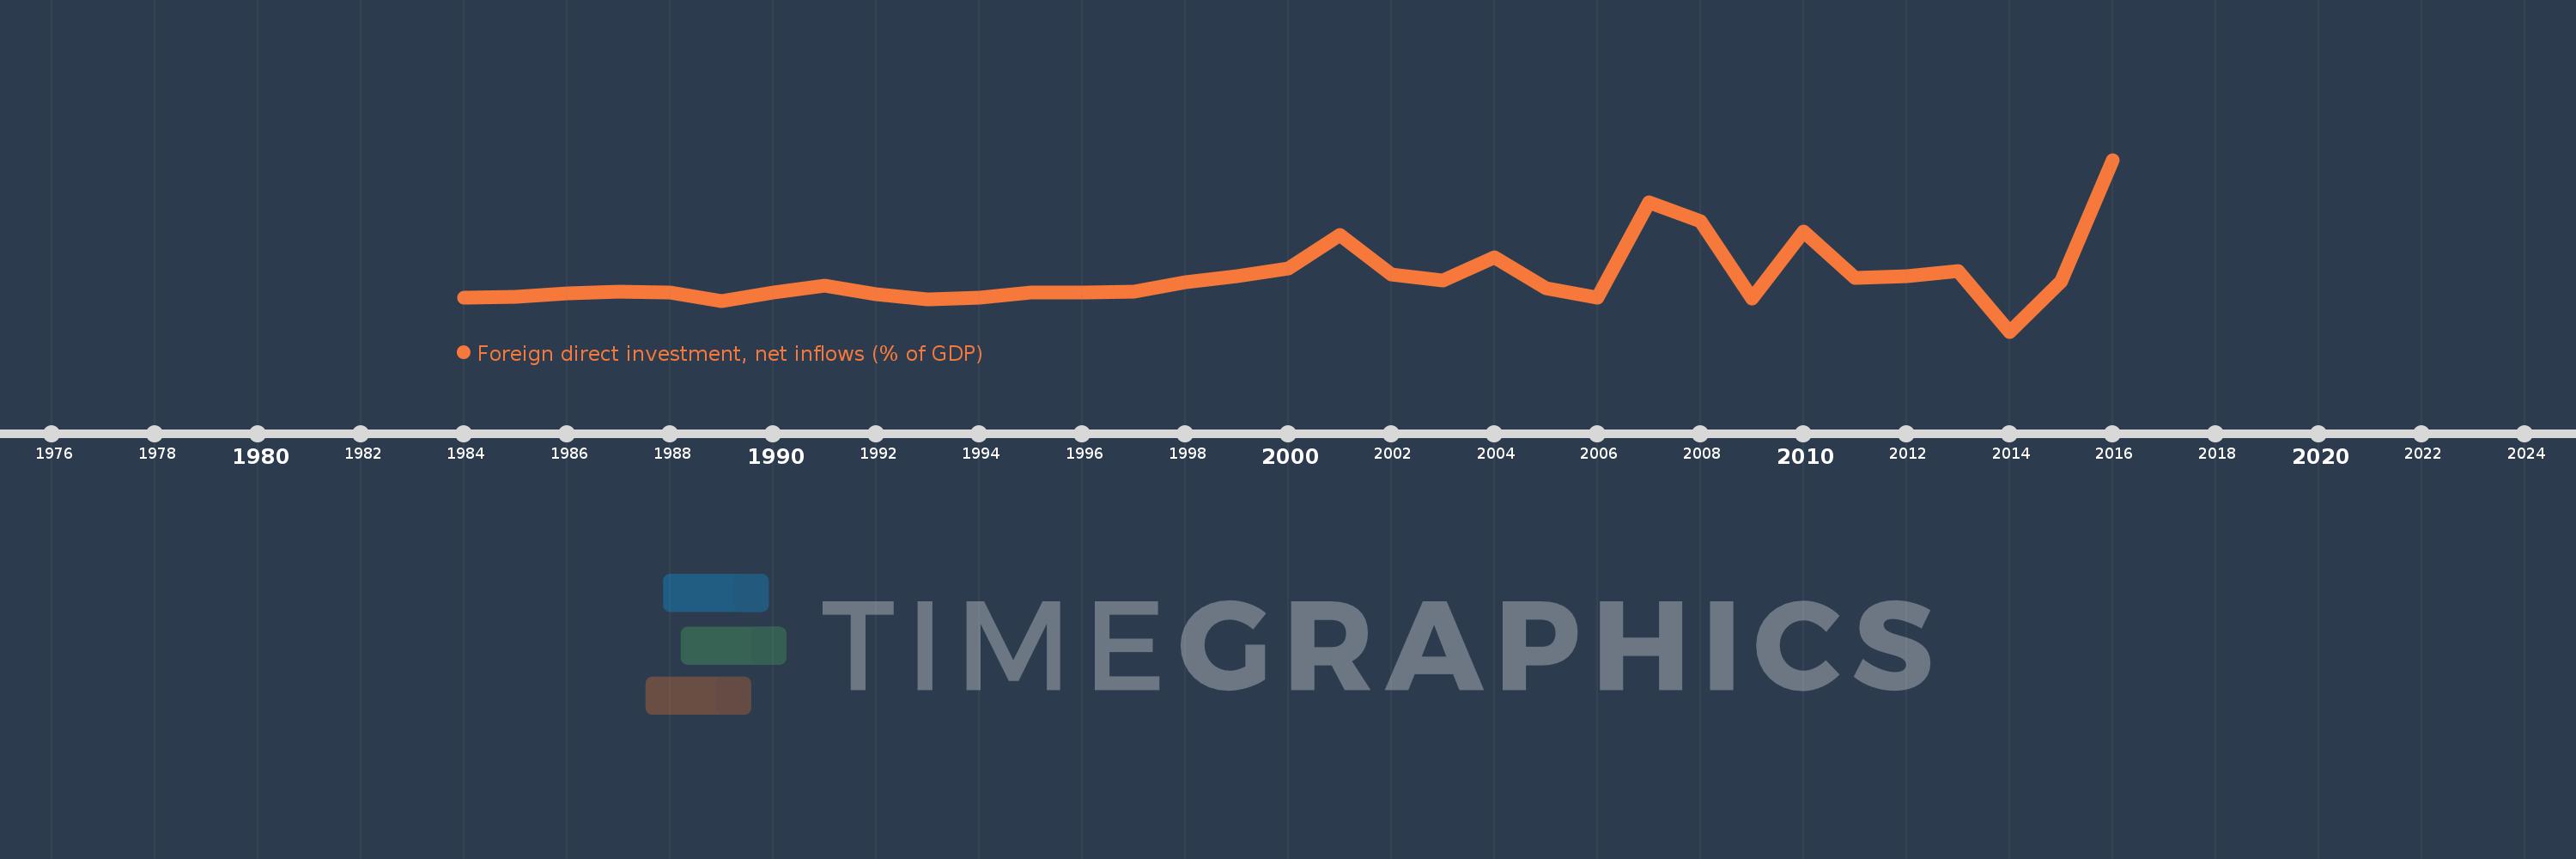
En esta escala de tiempo se presenta un gráfico de 1984 y 2016 de Switzerland. Los datos de 1983 están ausentes. El número de observaciones reales por fecha: 33.
Fuente (nombre):
Indicadores del desarrollo mundial
Fuente (organización):
International Monetary Fund, International Financial Statistics and Balance of Payments databases, World Bank, International Debt Statistics, and World Bank and OECD GDP estimates.
Categorías:
Economy & Growth, Financial Sector, Climate Change
Se ha actualizado:
23 abr 2017 año
Los indicadores de los cambios de valor en los últimos años
Mínimo:
-3.636
1 ene 2014 año
Máximo:
17.847
1 ene 2016 año
A la fecha de observación
Valor
Cambio absoluto
El cambio con respecto al valor anterior
1 ene 1984 año
0.579
+0.579
0.0%
1 ene 1985 año
0.733
+0.154
26.65%
1 ene 1986 año
1.179
+0.446
60.84%
1 ene 1987 año
1.377
+0.198
16.83%
1 ene 1988 año
1.202
-0.175
-12.7%
1 ene 1989 año
0.194
-1.008
-83.86%
1 ene 1990 año
1.239
+1.045
538.22%
1 ene 1991 año
2.154
+0.915
73.87%
1 ene 1992 año
1.09
-1.064
-49.4%
1 ene 1993 año
0.416
-0.674
-61.81%
1 ene 1994 año
0.647
+0.231
55.53%
1 ene 1995 año
1.262
+0.614
94.89%
1 ene 1996 año
1.217
-0.045
-3.56%
1 ene 1997 año
1.327
+0.11
9.04%
1 ene 1998 año
2.549
+1.223
92.15%
1 ene 1999 año
3.271
+0.722
28.32%
1 ene 2000 año
4.287
+1.015
31.04%
1 ene 2001 año
8.496
+4.21
98.21%
1 ene 2002 año
3.505
-4.992
-58.75%
1 ene 2003 año
2.742
-0.762
-21.75%
1 ene 2004 año
5.603
+2.86
104.31%
1 ene 2005 año
1.805
-3.798
-67.79%
1 ene 2006 año
0.654
-1.151
-63.77%
1 ene 2007 año
12.526
+11.872
1.82 mil%
1 ene 2008 año
10.198
-2.327
-18.58%
1 ene 2009 año
0.542
-9.656
-94.68%
1 ene 2010 año
8.833
+8.291
1.53 mil%
1 ene 2011 año
3.04
-5.793
-65.58%
1 ene 2012 año
3.332
+0.291
9.58%
1 ene 2013 año
3.953
+0.621
18.65%
1 ene 2014 año
-3.636
-7.588
-191.98%
1 ene 2015 año
2.615
+6.251
-171.93%
1 ene 2016 año
17.847
+15.232
582.49%
Ranking de los países por los datos estadísticos actuales


Comentarios: