29
/es/
es
AIzaSyAYiBZKx7MnpbEhh9jyipgxe19OcubqV5w
April 1, 2024
127328
Equatorial Guinea
GNQ
true
2
1
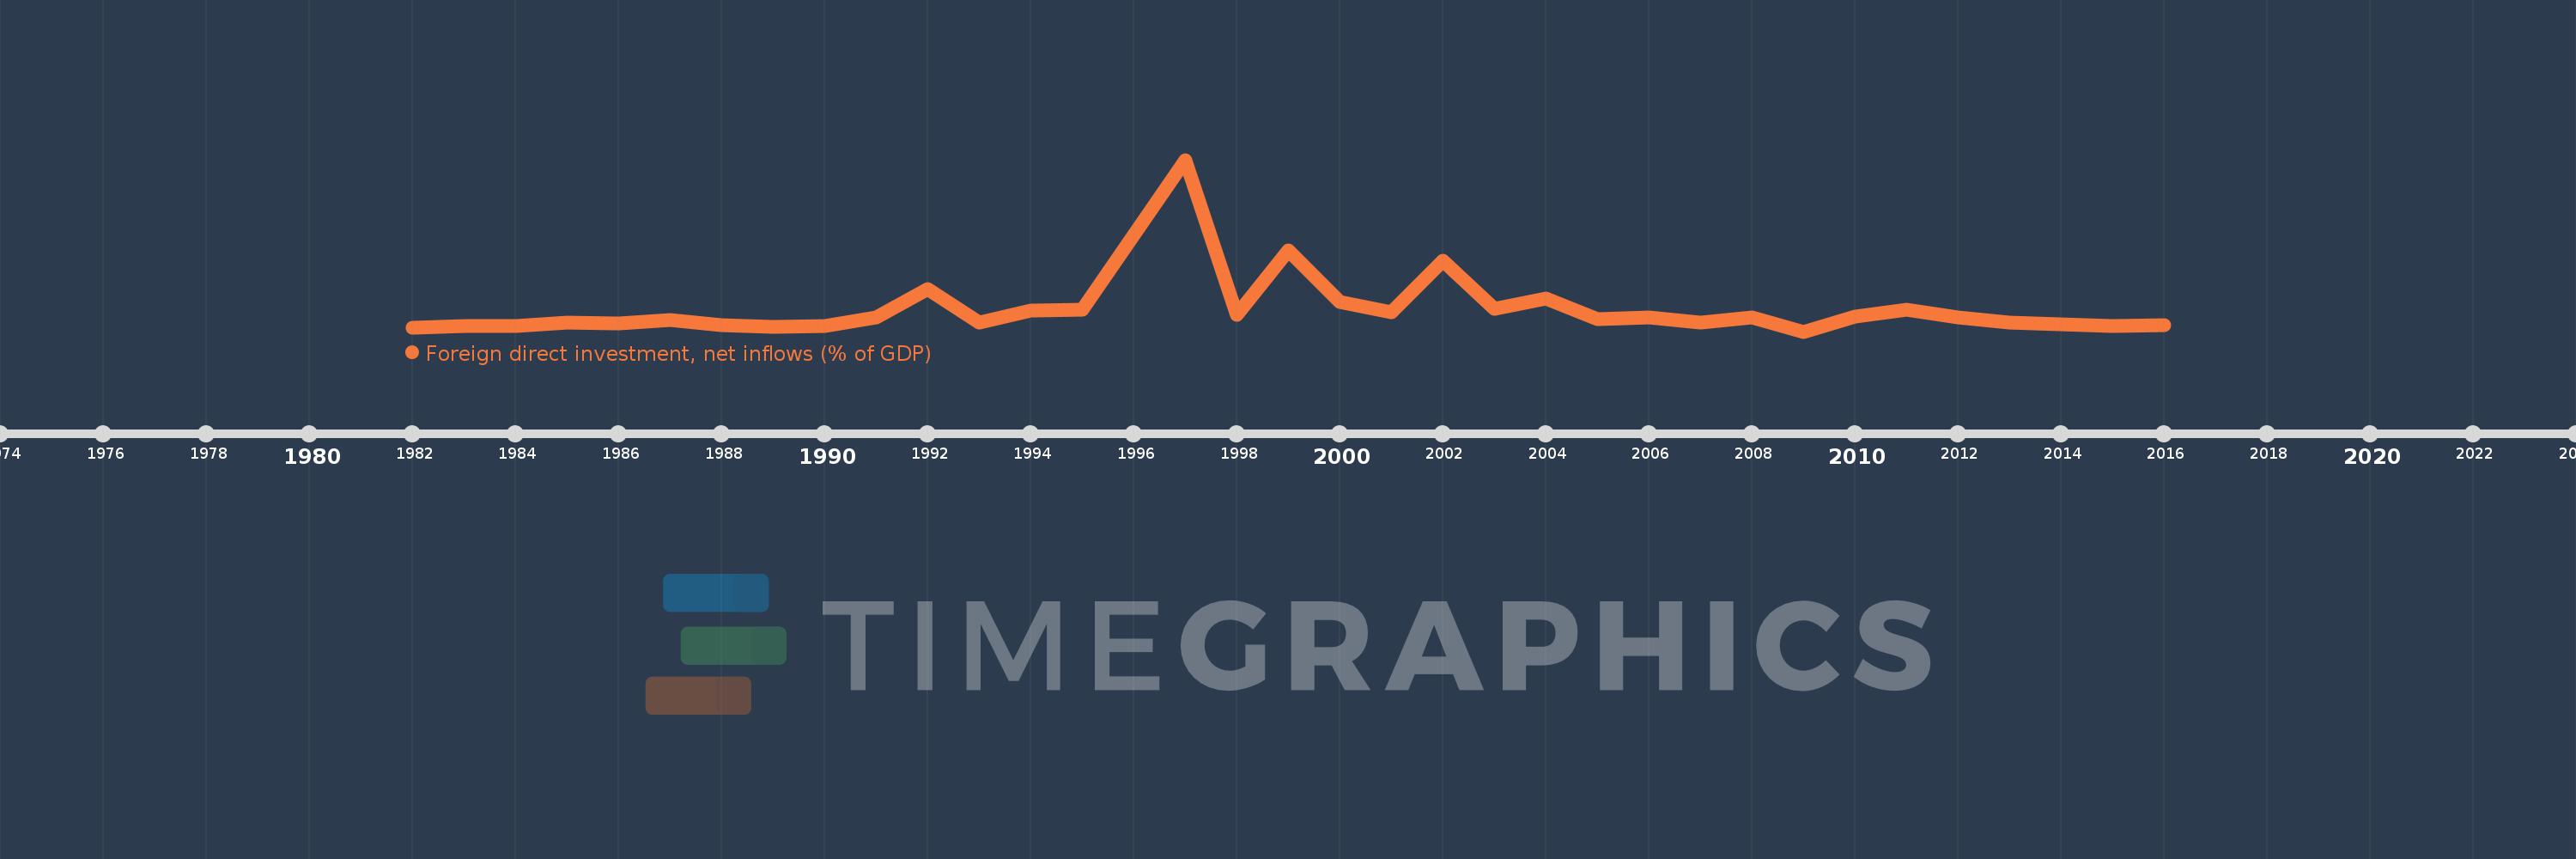
Foreign direct investment, net inflows (% of GDP)
2016,2015,2014,2013,2012,2011,2010,2009,2008,2007,2006,2005,2004,2003,2002,2001,2000,1999,1998,1997,1996,1995,1994,1993,1992,1991,1990,1989,1988,1987,1986,1985,1984,1983,1982
Estas estadísticas en otros países:
AfghanistanAlbaniaAlgeriaAngolaAntigua and BarbudaArab WorldArgentinaArmeniaArubaAustraliaAustriaAzerbaijanBahamas, TheBahrainBangladeshBarbadosBelarusBelgiumBelizeBeninBermudaBhutanBoliviaBosnia and HerzegovinaBotswanaBrazilBrunei DarussalamBulgariaBurkina FasoBurundiCabo VerdeCambodiaCameroonCanadaCaribbean small statesCayman IslandsCentral African RepublicCentral Europe and the BalticsChadChileChinaColombiaComorosCongo, Dem. Rep.Congo, Rep.Costa RicaCote d'IvoireCroatiaCyprusCzech RepublicDenmarkDjiboutiDominicaDominican RepublicEarly-demographic dividendEast Asia & PacificEast Asia & Pacific (excluding high income)East Asia & Pacific (IDA & IBRD countries)EcuadorEgypt, Arab Rep.El SalvadorEquatorial GuineaEritreaEstoniaEthiopiaEuro areaEurope & Central AsiaEurope & Central Asia (excluding high income)Europe & Central Asia (IDA & IBRD countries)European UnionFijiFinlandFragile and conflict affected situationsFranceFrench PolynesiaGabonGambia, TheGeorgiaGermanyGhanaGreeceGrenadaGuatemalaGuineaGuinea-BissauGuyanaHaitiHeavily indebted poor countries (HIPC)High incomeHondurasHong Kong SAR, ChinaHungaryIBRD onlyIcelandIDA & IBRD totalIDA blendIDA onlyIDA totalIndiaIndonesiaIran, Islamic Rep.IraqIrelandIsraelItalyJamaicaJapanJordanKazakhstanKenyaKiribatiKorea, Rep.KosovoKuwaitKyrgyz RepublicLao PDRLate-demographic dividendLatin America & Caribbean Latin America & Caribbean (excluding high income)Latin America & the Caribbean (IDA & IBRD countries)LatviaLeast developed countries: UN classificationLebanonLesothoLiberiaLibyaLithuaniaLow & middle incomeLow incomeLower middle incomeLuxembourgMacao SAR, ChinaMacedonia, FYRMadagascarMalawiMalaysiaMaldivesMaliMaltaMarshall IslandsMauritaniaMauritiusMexicoMicronesia, Fed. Sts.Middle East & North AfricaMiddle East & North Africa (excluding high income)Middle East & North Africa (IDA & IBRD countries)Middle incomeMoldovaMongoliaMontenegroMoroccoMozambiqueMyanmarNamibiaNauruNepalNetherlandsNew CaledoniaNew ZealandNicaraguaNigerNigeriaNorth AmericaNorwayOECD membersOmanOther small statesPacific island small statesPakistanPalauPanamaPapua New GuineaParaguayPeruPhilippinesPolandPortugalPost-demographic dividendPre-demographic dividendQatarRomaniaRussian FederationRwandaSamoaSao Tome and PrincipeSaudi ArabiaSenegalSerbiaSeychellesSierra LeoneSingaporeSlovak RepublicSloveniaSmall statesSolomon IslandsSomaliaSouth AfricaSouth AsiaSouth Asia (IDA & IBRD)South SudanSpainSri LankaSt. Kitts and NevisSt. LuciaSt. Vincent and the GrenadinesSub-Saharan Africa Sub-Saharan Africa (excluding high income)Sub-Saharan Africa (IDA & IBRD countries)SudanSurinameSwazilandSwedenSwitzerlandSyrian Arab RepublicTajikistanTanzaniaThailandTimor-LesteTogoTongaTrinidad and TobagoTunisiaTurkeyTurkmenistanTuvaluUgandaUkraineUnited Arab EmiratesUnited KingdomUnited StatesUpper middle incomeUruguayUzbekistanVanuatuVenezuela, RBVietnamWest Bank and GazaWorldYemen, Rep.ZambiaZimbabwe línea de tiempo (timeline):
En esta escala de tiempo se presenta un gráfico de 1982 y 2016 de Equatorial Guinea. Los datos de 1981 están ausentes. El número de observaciones reales por fecha: 35.
Fuente (nombre):
Indicadores del desarrollo mundial
Fuente (organización):
International Monetary Fund, International Financial Statistics and Balance of Payments databases, World Bank, International Debt Statistics, and World Bank and OECD GDP estimates.
Categorías:
Economy & Growth, Financial Sector, Climate Change
Se ha actualizado:
23 abr 2017 año
Los indicadores de los cambios de valor en los últimos años
Mínimo:
-4.02
1 ene 2009 año
Máximo:
161.824
1 ene 1997 año
A la fecha de observación
Valor
Cambio absoluto
El cambio con respecto al valor anterior
1 ene 1982 año
-0.49
-0.49
0.0%
1 ene 1983 año
1.016
+1.506
-307.31%
1 ene 1984 año
1.17
+0.154
15.17%
1 ene 1985 año
4.312
+3.142
268.56%
1 ene 1986 año
3.928
-0.384
-8.91%
1 ene 1987 año
7.368
+3.44
87.59%
1 ene 1988 año
1.8
-5.569
-75.57%
1 ene 1989 año
0.497
-1.302
-72.37%
1 ene 1990 año
1.009
+0.511
102.8%
1 ene 1991 año
9.877
+8.868
879.25%
1 ene 1992 año
37.261
+27.384
277.26%
1 ene 1993 año
4.468
-32.793
-88.01%
1 ene 1994 año
16.393
+11.925
266.91%
1 ene 1995 año
16.859
+0.467
2.85%
1 ene 1996 año
89.476
+72.616
430.71%
1 ene 1997 año
161.824
+72.348
80.86%
1 ene 1998 año
12.084
-149.74
-92.53%
1 ene 1999 año
74.124
+62.04
513.41%
1 ene 2000 año
24.842
-49.282
-66.49%
1 ene 2001 año
14.771
-10.071
-40.54%
1 ene 2002 año
64.384
+49.614
335.9%
1 ene 2003 año
17.899
-46.485
-72.2%
1 ene 2004 año
27.761
+9.861
55.09%
1 ene 2005 año
7.729
-20.031
-72.16%
1 ene 2006 año
9.36
+1.631
21.1%
1 ene 2007 año
4.655
-4.705
-50.27%
1 ene 2008 año
9.507
+4.852
104.24%
1 ene 2009 año
-4.02
-13.527
-142.28%
1 ene 2010 año
10.888
+14.908
-370.87%
1 ene 2011 año
16.775
+5.887
54.06%
1 ene 2012 año
9.26
-7.515
-44.8%
1 ene 2013 año
4.401
-4.859
-52.48%
1 ene 2014 año
3.33
-1.07
-24.32%
1 ene 2015 año
1.489
-1.841
-55.29%
1 ene 2016 año
2.591
+1.102
74.01%
Ranking de los países por los datos estadísticos actuales


Comentarios: