29
/es/
es
AIzaSyAYiBZKx7MnpbEhh9jyipgxe19OcubqV5w
April 1, 2024
124783
Egypt, Arab Rep.
EGY
true
2
1
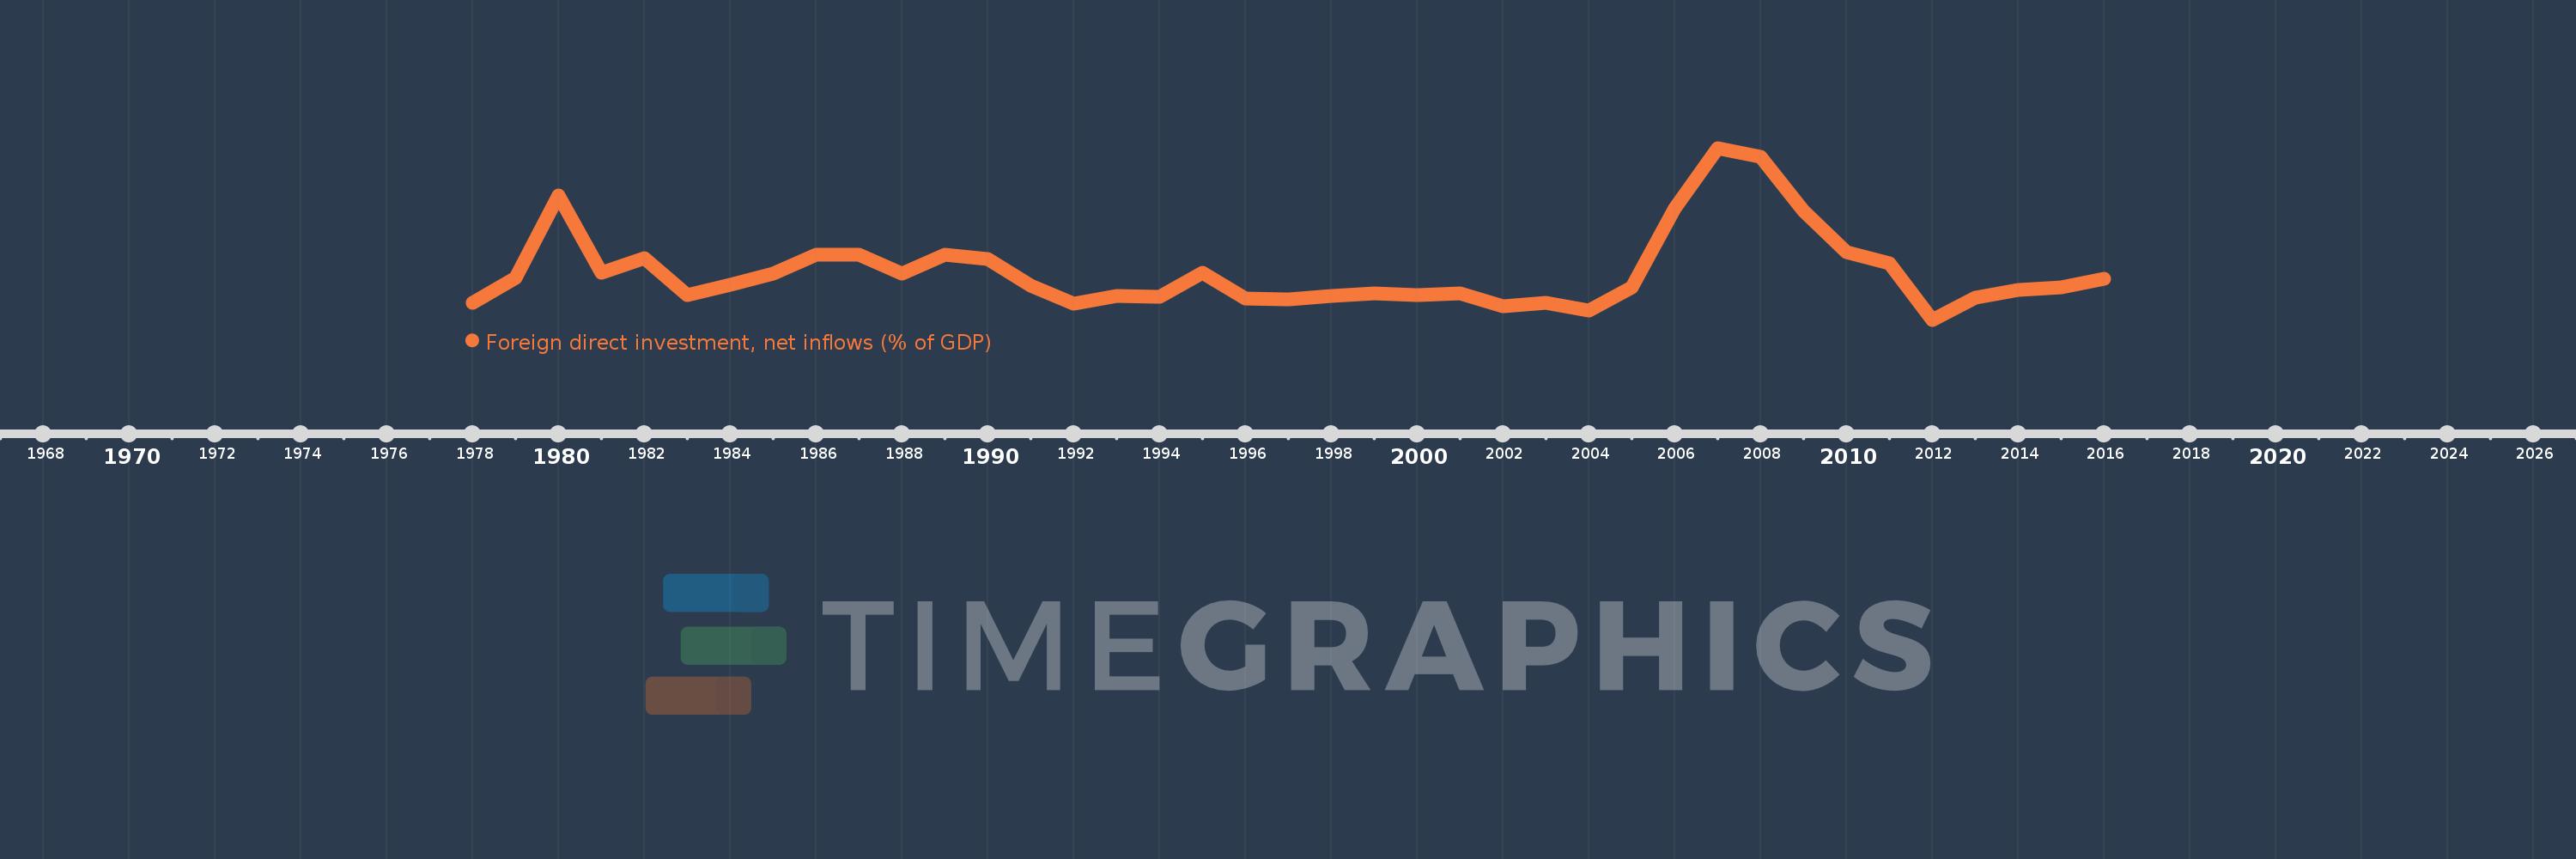
Foreign direct investment, net inflows (% of GDP)
2016,2015,2014,2013,2012,2011,2010,2009,2008,2007,2006,2005,2004,2003,2002,2001,2000,1999,1998,1997,1996,1995,1994,1993,1992,1991,1990,1989,1988,1987,1986,1985,1984,1983,1982,1981,1980,1979,1978
Estas estadísticas en otros países:
AfghanistanAlbaniaAlgeriaAngolaAntigua and BarbudaArab WorldArgentinaArmeniaArubaAustraliaAustriaAzerbaijanBahamas, TheBahrainBangladeshBarbadosBelarusBelgiumBelizeBeninBermudaBhutanBoliviaBosnia and HerzegovinaBotswanaBrazilBrunei DarussalamBulgariaBurkina FasoBurundiCabo VerdeCambodiaCameroonCanadaCaribbean small statesCayman IslandsCentral African RepublicCentral Europe and the BalticsChadChileChinaColombiaComorosCongo, Dem. Rep.Congo, Rep.Costa RicaCote d'IvoireCroatiaCyprusCzech RepublicDenmarkDjiboutiDominicaDominican RepublicEarly-demographic dividendEast Asia & PacificEast Asia & Pacific (excluding high income)East Asia & Pacific (IDA & IBRD countries)EcuadorEgypt, Arab Rep.El SalvadorEquatorial GuineaEritreaEstoniaEthiopiaEuro areaEurope & Central AsiaEurope & Central Asia (excluding high income)Europe & Central Asia (IDA & IBRD countries)European UnionFijiFinlandFragile and conflict affected situationsFranceFrench PolynesiaGabonGambia, TheGeorgiaGermanyGhanaGreeceGrenadaGuatemalaGuineaGuinea-BissauGuyanaHaitiHeavily indebted poor countries (HIPC)High incomeHondurasHong Kong SAR, ChinaHungaryIBRD onlyIcelandIDA & IBRD totalIDA blendIDA onlyIDA totalIndiaIndonesiaIran, Islamic Rep.IraqIrelandIsraelItalyJamaicaJapanJordanKazakhstanKenyaKiribatiKorea, Rep.KosovoKuwaitKyrgyz RepublicLao PDRLate-demographic dividendLatin America & Caribbean Latin America & Caribbean (excluding high income)Latin America & the Caribbean (IDA & IBRD countries)LatviaLeast developed countries: UN classificationLebanonLesothoLiberiaLibyaLithuaniaLow & middle incomeLow incomeLower middle incomeLuxembourgMacao SAR, ChinaMacedonia, FYRMadagascarMalawiMalaysiaMaldivesMaliMaltaMarshall IslandsMauritaniaMauritiusMexicoMicronesia, Fed. Sts.Middle East & North AfricaMiddle East & North Africa (excluding high income)Middle East & North Africa (IDA & IBRD countries)Middle incomeMoldovaMongoliaMontenegroMoroccoMozambiqueMyanmarNamibiaNauruNepalNetherlandsNew CaledoniaNew ZealandNicaraguaNigerNigeriaNorth AmericaNorwayOECD membersOmanOther small statesPacific island small statesPakistanPalauPanamaPapua New GuineaParaguayPeruPhilippinesPolandPortugalPost-demographic dividendPre-demographic dividendQatarRomaniaRussian FederationRwandaSamoaSao Tome and PrincipeSaudi ArabiaSenegalSerbiaSeychellesSierra LeoneSingaporeSlovak RepublicSloveniaSmall statesSolomon IslandsSomaliaSouth AfricaSouth AsiaSouth Asia (IDA & IBRD)South SudanSpainSri LankaSt. Kitts and NevisSt. LuciaSt. Vincent and the GrenadinesSub-Saharan Africa Sub-Saharan Africa (excluding high income)Sub-Saharan Africa (IDA & IBRD countries)SudanSurinameSwazilandSwedenSwitzerlandSyrian Arab RepublicTajikistanTanzaniaThailandTimor-LesteTogoTongaTrinidad and TobagoTunisiaTurkeyTurkmenistanTuvaluUgandaUkraineUnited Arab EmiratesUnited KingdomUnited StatesUpper middle incomeUruguayUzbekistanVanuatuVenezuela, RBVietnamWest Bank and GazaWorldYemen, Rep.ZambiaZimbabwe línea de tiempo (timeline):
En esta escala de tiempo se presenta un gráfico de 1978 y 2016 de Egypt, Arab Rep.. Los datos de 1977 están ausentes. El número de observaciones reales por fecha: 39.
Fuente (nombre):
Indicadores del desarrollo mundial
Fuente (organización):
International Monetary Fund, International Financial Statistics and Balance of Payments databases, World Bank, International Debt Statistics, and World Bank and OECD GDP estimates.
Categorías:
Economy & Growth, Financial Sector, Climate Change
Se ha actualizado:
23 abr 2017 año
Los indicadores de los cambios de valor en los últimos años
Mínimo:
-0.205
1 ene 2012 año
Máximo:
9.344
1 ene 2007 año
A la fecha de observación
Valor
Cambio absoluto
El cambio con respecto al valor anterior
1 ene 1978 año
0.716
+0.716
0.0%
1 ene 1979 año
2.143
+1.427
199.28%
1 ene 1980 año
6.701
+4.559
212.77%
1 ene 1981 año
2.393
-4.308
-64.29%
1 ene 1982 año
3.215
+0.822
34.37%
1 ene 1983 año
1.147
-2.068
-64.32%
1 ene 1984 año
1.741
+0.594
51.81%
1 ene 1985 año
2.379
+0.638
36.64%
1 ene 1986 año
3.395
+1.015
42.66%
1 ene 1987 año
3.393
-0.002
-0.05%
1 ene 1988 año
2.34
-1.053
-31.05%
1 ene 1989 año
3.396
+1.056
45.14%
1 ene 1990 año
3.153
-0.243
-7.14%
1 ene 1991 año
1.702
-1.451
-46.03%
1 ene 1992 año
0.684
-1.017
-59.79%
1 ene 1993 año
1.097
+0.412
60.25%
1 ene 1994 año
1.058
-0.038
-3.48%
1 ene 1995 año
2.42
+1.362
128.65%
1 ene 1996 año
0.994
-1.426
-58.93%
1 ene 1997 año
0.94
-0.054
-5.39%
1 ene 1998 año
1.135
+0.195
20.73%
1 ene 1999 año
1.268
+0.133
11.72%
1 ene 2000 año
1.174
-0.094
-7.41%
1 ene 2001 año
1.237
+0.063
5.33%
1 ene 2002 año
0.522
-0.715
-57.78%
1 ene 2003 año
0.736
+0.214
40.99%
1 ene 2004 año
0.286
-0.45
-61.12%
1 ene 2005 año
1.59
+1.303
455.24%
1 ene 2006 año
5.994
+4.404
277.07%
1 ene 2007 año
9.344
+3.35
55.89%
1 ene 2008 año
8.874
-0.47
-5.03%
1 ene 2009 año
5.831
-3.042
-34.28%
1 ene 2010 año
3.551
-2.28
-39.1%
1 ene 2011 año
2.917
-0.634
-17.86%
1 ene 2012 año
-0.205
-3.122
-107.01%
1 ene 2013 año
1.012
+1.217
-594.97%
1 ene 2014 año
1.466
+0.453
44.78%
1 ene 2015 año
1.586
+0.121
8.24%
1 ene 2016 año
2.081
+0.495
31.2%
Ranking de los países por los datos estadísticos actuales


Comentarios: