29
/es/
es
AIzaSyAYiBZKx7MnpbEhh9jyipgxe19OcubqV5w
April 1, 2024
26498
Early-demographic dividend
EAR
false
2
1
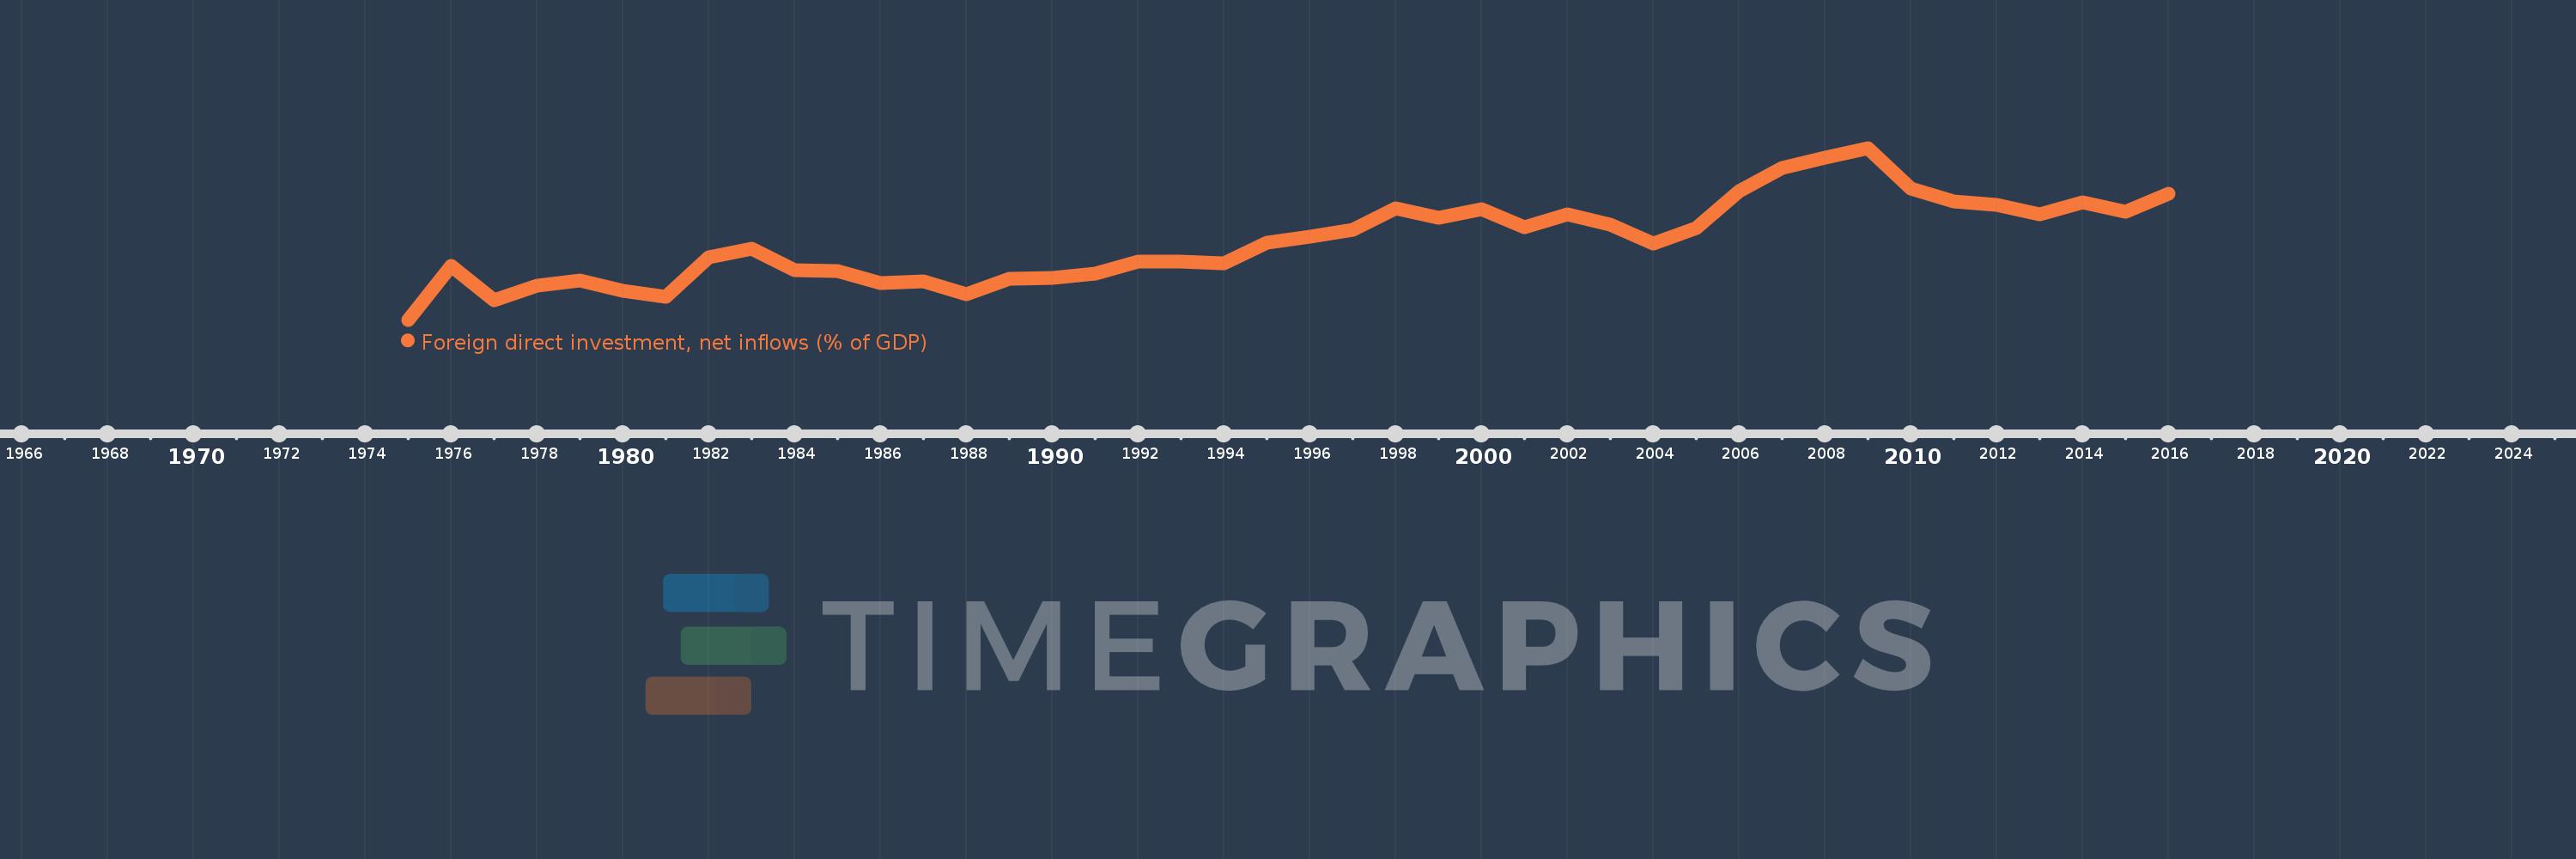
Foreign direct investment, net inflows (% of GDP)
2016,2015,2014,2013,2012,2011,2010,2009,2008,2007,2006,2005,2004,2003,2002,2001,2000,1999,1998,1997,1996,1995,1994,1993,1992,1991,1990,1989,1988,1987,1986,1985,1984,1983,1982,1981,1980,1979,1978,1977,1976,1975
Estas estadísticas en otros países:
AfghanistanAlbaniaAlgeriaAngolaAntigua and BarbudaArab WorldArgentinaArmeniaArubaAustraliaAustriaAzerbaijanBahamas, TheBahrainBangladeshBarbadosBelarusBelgiumBelizeBeninBermudaBhutanBoliviaBosnia and HerzegovinaBotswanaBrazilBrunei DarussalamBulgariaBurkina FasoBurundiCabo VerdeCambodiaCameroonCanadaCaribbean small statesCayman IslandsCentral African RepublicCentral Europe and the BalticsChadChileChinaColombiaComorosCongo, Dem. Rep.Congo, Rep.Costa RicaCote d'IvoireCroatiaCyprusCzech RepublicDenmarkDjiboutiDominicaDominican RepublicEarly-demographic dividendEast Asia & PacificEast Asia & Pacific (excluding high income)East Asia & Pacific (IDA & IBRD countries)EcuadorEgypt, Arab Rep.El SalvadorEquatorial GuineaEritreaEstoniaEthiopiaEuro areaEurope & Central AsiaEurope & Central Asia (excluding high income)Europe & Central Asia (IDA & IBRD countries)European UnionFijiFinlandFragile and conflict affected situationsFranceFrench PolynesiaGabonGambia, TheGeorgiaGermanyGhanaGreeceGrenadaGuatemalaGuineaGuinea-BissauGuyanaHaitiHeavily indebted poor countries (HIPC)High incomeHondurasHong Kong SAR, ChinaHungaryIBRD onlyIcelandIDA & IBRD totalIDA blendIDA onlyIDA totalIndiaIndonesiaIran, Islamic Rep.IraqIrelandIsraelItalyJamaicaJapanJordanKazakhstanKenyaKiribatiKorea, Rep.KosovoKuwaitKyrgyz RepublicLao PDRLate-demographic dividendLatin America & Caribbean Latin America & Caribbean (excluding high income)Latin America & the Caribbean (IDA & IBRD countries)LatviaLeast developed countries: UN classificationLebanonLesothoLiberiaLibyaLithuaniaLow & middle incomeLow incomeLower middle incomeLuxembourgMacao SAR, ChinaMacedonia, FYRMadagascarMalawiMalaysiaMaldivesMaliMaltaMarshall IslandsMauritaniaMauritiusMexicoMicronesia, Fed. Sts.Middle East & North AfricaMiddle East & North Africa (excluding high income)Middle East & North Africa (IDA & IBRD countries)Middle incomeMoldovaMongoliaMontenegroMoroccoMozambiqueMyanmarNamibiaNauruNepalNetherlandsNew CaledoniaNew ZealandNicaraguaNigerNigeriaNorth AmericaNorwayOECD membersOmanOther small statesPacific island small statesPakistanPalauPanamaPapua New GuineaParaguayPeruPhilippinesPolandPortugalPost-demographic dividendPre-demographic dividendQatarRomaniaRussian FederationRwandaSamoaSao Tome and PrincipeSaudi ArabiaSenegalSerbiaSeychellesSierra LeoneSingaporeSlovak RepublicSloveniaSmall statesSolomon IslandsSomaliaSouth AfricaSouth AsiaSouth Asia (IDA & IBRD)South SudanSpainSri LankaSt. Kitts and NevisSt. LuciaSt. Vincent and the GrenadinesSub-Saharan Africa Sub-Saharan Africa (excluding high income)Sub-Saharan Africa (IDA & IBRD countries)SudanSurinameSwazilandSwedenSwitzerlandSyrian Arab RepublicTajikistanTanzaniaThailandTimor-LesteTogoTongaTrinidad and TobagoTunisiaTurkeyTurkmenistanTuvaluUgandaUkraineUnited Arab EmiratesUnited KingdomUnited StatesUpper middle incomeUruguayUzbekistanVanuatuVenezuela, RBVietnamWest Bank and GazaWorldYemen, Rep.ZambiaZimbabwe línea de tiempo (timeline):
En esta escala de tiempo se presenta un gráfico de 1975 y 2016 de Early-demographic dividend. Los datos de 1974 están ausentes. El número de observaciones reales por fecha: 42.
Fuente (nombre):
Indicadores del desarrollo mundial
Fuente (organización):
International Monetary Fund, International Financial Statistics and Balance of Payments databases, World Bank, International Debt Statistics, and World Bank and OECD GDP estimates.
Categorías:
Economy & Growth, Financial Sector, Climate Change
Se ha actualizado:
23 abr 2017 año
Los indicadores de los cambios de valor en los últimos años
Mínimo:
-0.386
1 ene 1975 año
Máximo:
3.257
1 ene 2009 año
A la fecha de observación
Valor
Cambio absoluto
El cambio con respecto al valor anterior
1 ene 1975 año
-0.386
-0.386
0.0%
1 ene 1976 año
0.748
+1.134
-294.03%
1 ene 1977 año
0.035
-0.713
-95.29%
1 ene 1978 año
0.339
+0.304
862.45%
1 ene 1979 año
0.45
+0.111
32.76%
1 ene 1980 año
0.225
-0.225
-50.0%
1 ene 1981 año
0.107
-0.118
-52.3%
1 ene 1982 año
0.943
+0.836
778.55%
1 ene 1983 año
1.126
+0.182
19.33%
1 ene 1984 año
0.669
-0.456
-40.53%
1 ene 1985 año
0.641
-0.029
-4.27%
1 ene 1986 año
0.398
-0.242
-37.83%
1 ene 1987 año
0.435
+0.037
9.16%
1 ene 1988 año
0.148
-0.287
-65.99%
1 ene 1989 año
0.481
+0.333
225.48%
1 ene 1990 año
0.494
+0.013
2.63%
1 ene 1991 año
0.593
+0.098
19.94%
1 ene 1992 año
0.851
+0.258
43.61%
1 ene 1993 año
0.842
-0.009
-1.06%
1 ene 1994 año
0.803
-0.039
-4.57%
1 ene 1995 año
1.256
+0.452
56.27%
1 ene 1996 año
1.373
+0.118
9.39%
1 ene 1997 año
1.513
+0.14
10.17%
1 ene 1998 año
1.985
+0.472
31.22%
1 ene 1999 año
1.774
-0.211
-10.64%
1 ene 2000 año
1.96
+0.186
10.49%
1 ene 2001 año
1.57
-0.39
-19.9%
1 ene 2002 año
1.855
+0.285
18.12%
1 ene 2003 año
1.63
-0.224
-12.09%
1 ene 2004 año
1.226
-0.405
-24.83%
1 ene 2005 año
1.559
+0.334
27.23%
1 ene 2006 año
2.349
+0.79
50.66%
1 ene 2007 año
2.841
+0.492
20.95%
1 ene 2008 año
3.046
+0.205
7.21%
1 ene 2009 año
3.257
+0.211
6.93%
1 ene 2010 año
2.393
-0.865
-26.54%
1 ene 2011 año
2.13
-0.263
-11.0%
1 ene 2012 año
2.054
-0.076
-3.58%
1 ene 2013 año
1.856
-0.198
-9.65%
1 ene 2014 año
2.106
+0.251
13.5%
1 ene 2015 año
1.897
-0.209
-9.91%
1 ene 2016 año
2.288
+0.39
20.56%
Ranking de los países por los datos estadísticos actuales


Comentarios: