29
/es/
es
AIzaSyAYiBZKx7MnpbEhh9jyipgxe19OcubqV5w
April 1, 2024
71800
Armenia
ARM
true
2
1
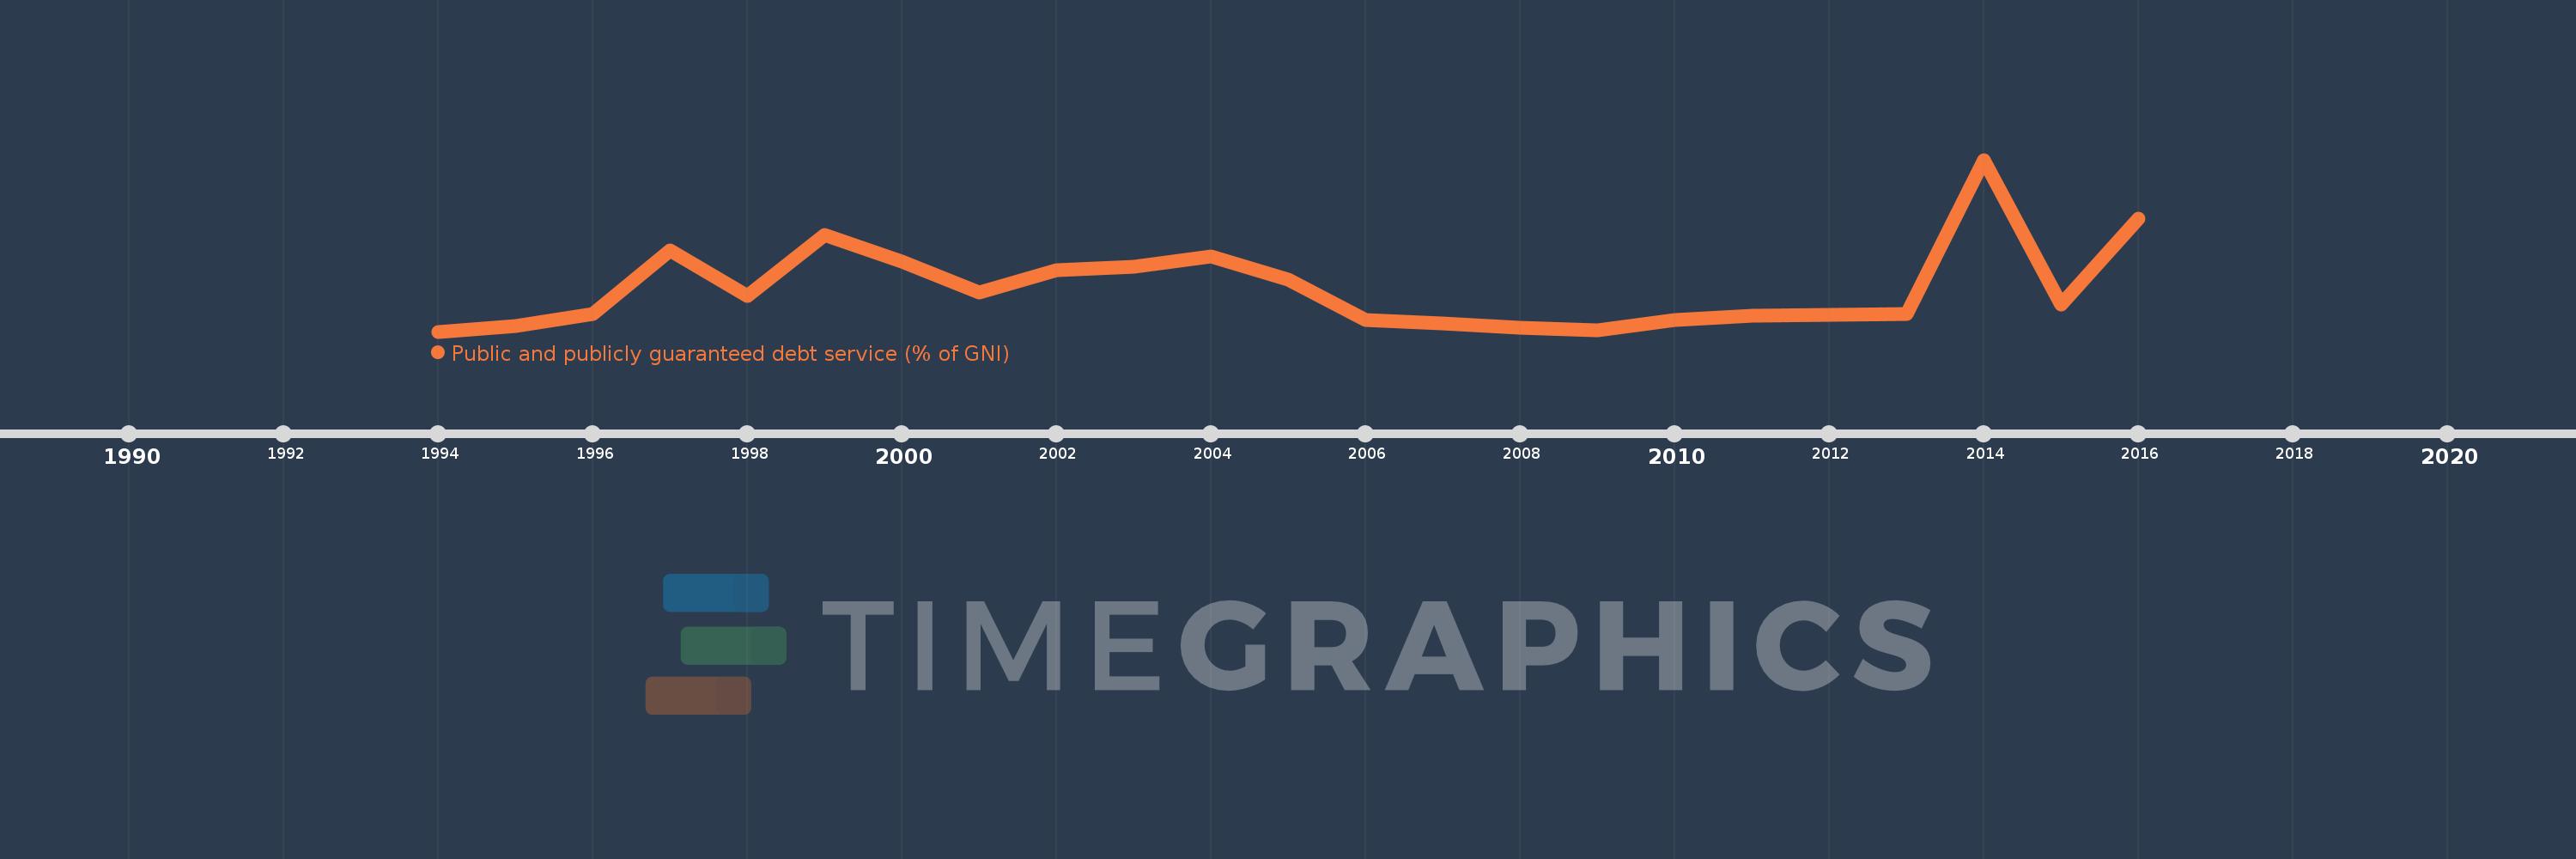
Public and publicly guaranteed debt service (% of GNI)
2016,2015,2014,2013,2012,2011,2010,2009,2008,2007,2006,2005,2004,2003,2002,2001,2000,1999,1998,1997,1996,1995,1994
Estas estadísticas en otros países:
línea de tiempo (timeline):
En esta escala de tiempo se presenta un gráfico de 1994 y 2016 de Armenia. Los datos de 1993 están ausentes. El número de observaciones reales por fecha: 23.
Fuente (nombre):
Indicadores del desarrollo mundial
Fuente (organización):
World Bank, International Debt Statistics.
Categorías:
External Debt
Se ha actualizado:
23 abr 2017 año
Los indicadores de los cambios de valor en los últimos años
Mínimo:
0.177
1 ene 1994 año
Máximo:
4.902
1 ene 2014 año
A la fecha de observación
Valor
Cambio absoluto
El cambio con respecto al valor anterior
1 ene 1994 año
0.177
+0.177
0.0%
1 ene 1995 año
0.338
+0.161
90.87%
1 ene 1996 año
0.651
+0.314
92.84%
1 ene 1997 año
2.404
+1.752
269.07%
1 ene 1998 año
1.153
-1.25
-52.02%
1 ene 1999 año
2.844
+1.69
146.58%
1 ene 2000 año
2.104
-0.739
-26.0%
1 ene 2001 año
1.258
-0.847
-40.24%
1 ene 2002 año
1.859
+0.601
47.82%
1 ene 2003 año
1.962
+0.103
5.53%
1 ene 2004 año
2.246
+0.284
14.48%
1 ene 2005 año
1.616
-0.63
-28.04%
1 ene 2006 año
0.488
-1.128
-69.78%
1 ene 2007 año
0.391
-0.097
-19.93%
1 ene 2008 año
0.275
-0.117
-29.8%
1 ene 2009 año
0.21
-0.065
-23.58%
1 ene 2010 año
0.49
+0.28
133.39%
1 ene 2011 año
0.607
+0.117
23.93%
1 ene 2012 año
0.632
+0.025
4.16%
1 ene 2013 año
0.664
+0.032
5.1%
1 ene 2014 año
4.902
+4.237
637.7%
1 ene 2015 año
0.927
-3.975
-81.1%
1 ene 2016 año
3.281
+2.355
254.14%
Ranking de los países por los datos estadísticos actuales


Comentarios: