29
/es/
es
AIzaSyAYiBZKx7MnpbEhh9jyipgxe19OcubqV5w
April 1, 2024
281613
Venezuela, RB
VEN
true
2
1
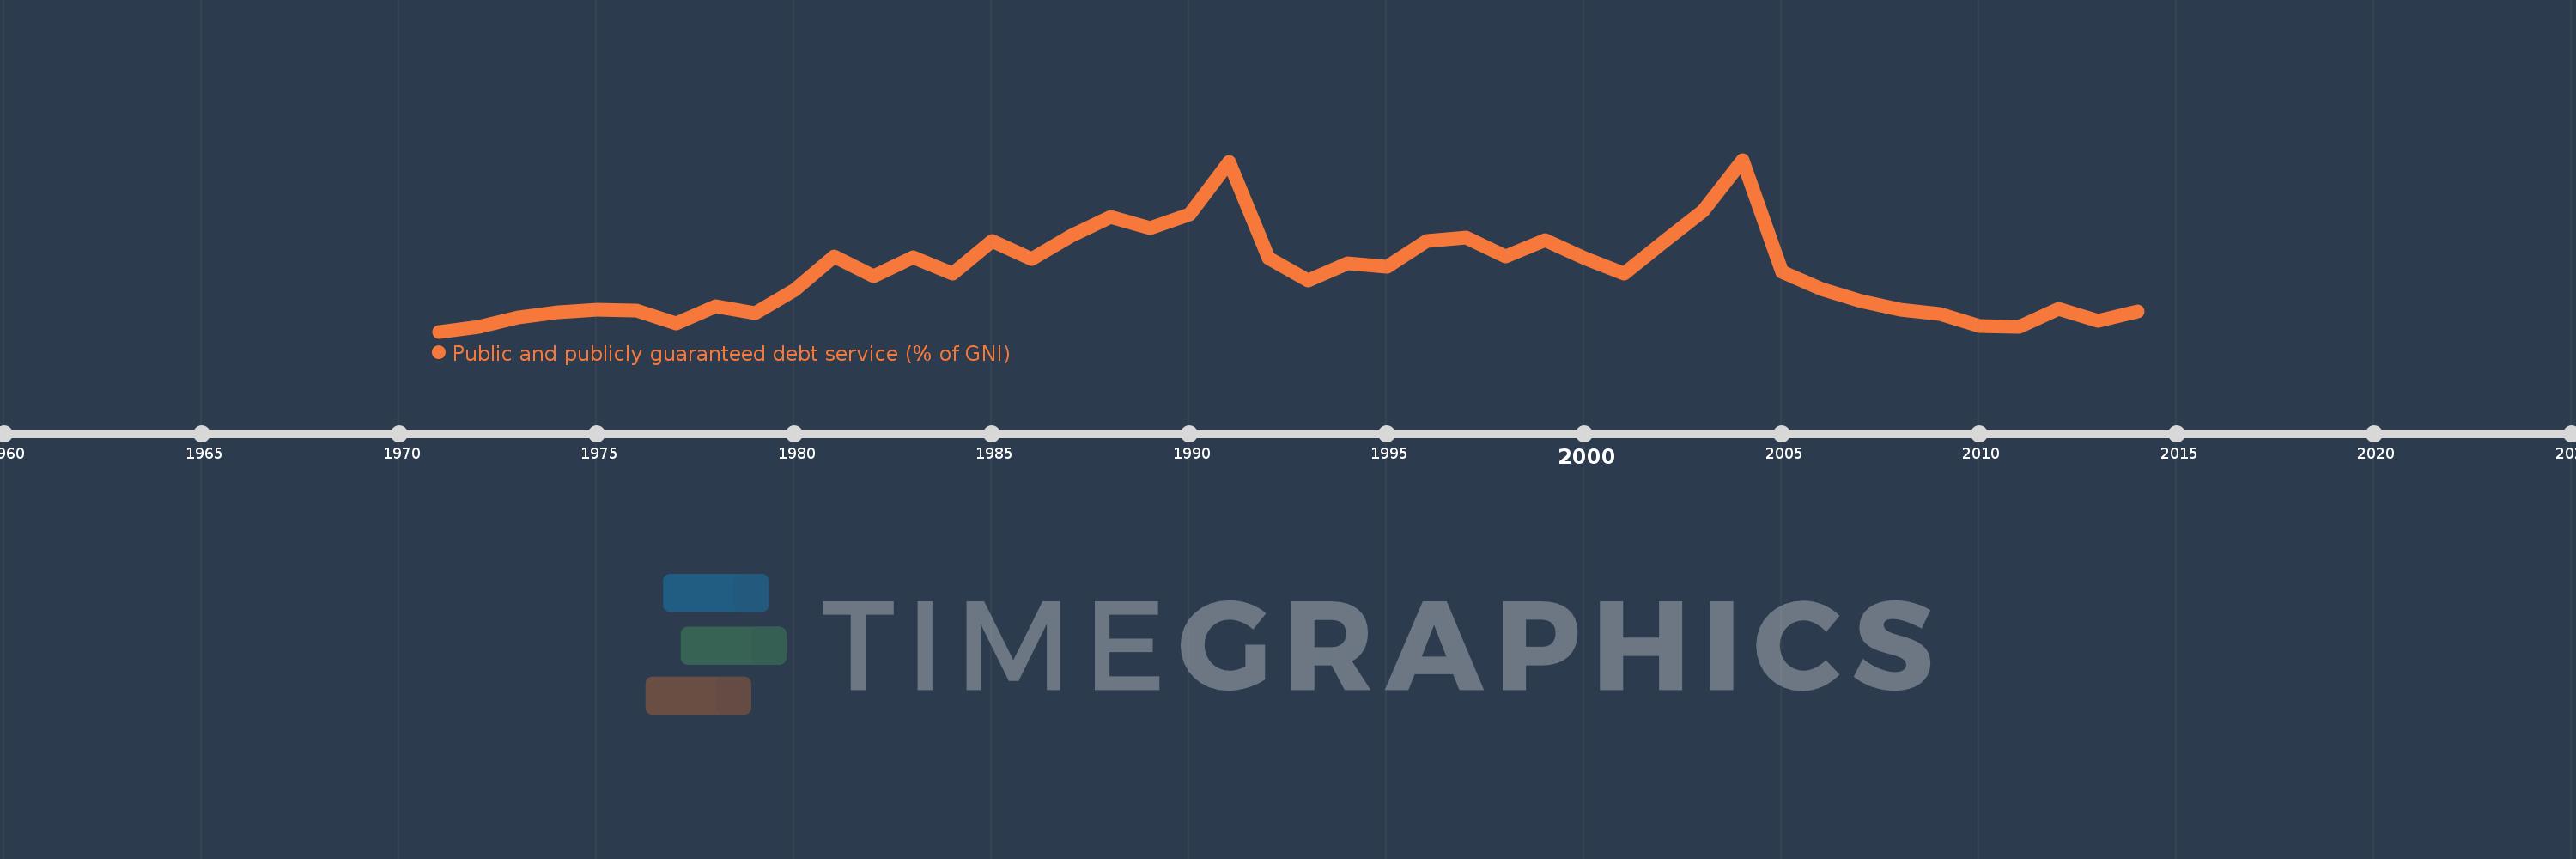
Public and publicly guaranteed debt service (% of GNI)
2014,2013,2012,2011,2010,2009,2008,2007,2006,2005,2004,2003,2002,2001,2000,1999,1998,1997,1996,1995,1994,1993,1992,1991,1990,1989,1988,1987,1986,1985,1984,1983,1982,1981,1980,1979,1978,1977,1976,1975,1974,1973,1972,1971
Estas estadísticas en otros países:
línea de tiempo (timeline):
En esta escala de tiempo se presenta un gráfico de 1971 y 2014 de Venezuela, RB. Los datos de 1970 están ausentes. El número de observaciones reales por fecha: 44.
Fuente (nombre):
Indicadores del desarrollo mundial
Fuente (organización):
World Bank, International Debt Statistics.
Categorías:
External Debt
Se ha actualizado:
23 abr 2017 año
Los indicadores de los cambios de valor en los últimos años
Mínimo:
0.724
1 ene 1971 año
Máximo:
9.125
1 ene 2004 año
A la fecha de observación
Valor
Cambio absoluto
El cambio con respecto al valor anterior
1 ene 1971 año
0.724
+0.724
0.0%
1 ene 1972 año
0.967
+0.243
33.54%
1 ene 1973 año
1.431
+0.464
47.95%
1 ene 1974 año
1.683
+0.252
17.6%
1 ene 1975 año
1.803
+0.12
7.16%
1 ene 1976 año
1.741
-0.062
-3.44%
1 ene 1977 año
1.139
-0.602
-34.57%
1 ene 1978 año
1.976
+0.837
73.44%
1 ene 1979 año
1.636
-0.34
-17.19%
1 ene 1980 año
2.776
+1.14
69.69%
1 ene 1981 año
4.402
+1.625
58.54%
1 ene 1982 año
3.423
-0.979
-22.24%
1 ene 1983 año
4.36
+0.937
27.37%
1 ene 1984 año
3.569
-0.79
-18.13%
1 ene 1985 año
5.159
+1.589
44.52%
1 ene 1986 año
4.29
-0.869
-16.85%
1 ene 1987 año
5.412
+1.122
26.17%
1 ene 1988 año
6.347
+0.935
17.27%
1 ene 1989 año
5.778
-0.569
-8.96%
1 ene 1990 año
6.475
+0.697
12.06%
1 ene 1991 año
9.013
+2.539
39.21%
1 ene 1992 año
4.299
-4.714
-52.3%
1 ene 1993 año
3.226
-1.074
-24.97%
1 ene 1994 año
4.079
+0.853
26.44%
1 ene 1995 año
3.888
-0.191
-4.67%
1 ene 1996 año
5.154
+1.266
32.57%
1 ene 1997 año
5.332
+0.178
3.45%
1 ene 1998 año
4.379
-0.953
-17.87%
1 ene 1999 año
5.187
+0.808
18.46%
1 ene 2000 año
4.305
-0.882
-17.0%
1 ene 2001 año
3.57
-0.735
-17.08%
1 ene 2002 año
5.12
+1.55
43.4%
1 ene 2003 año
6.639
+1.519
29.68%
1 ene 2004 año
9.125
+2.485
37.44%
1 ene 2005 año
3.654
-5.47
-59.95%
1 ene 2006 año
2.795
-0.859
-23.51%
1 ene 2007 año
2.224
-0.571
-20.44%
1 ene 2008 año
1.781
-0.443
-19.93%
1 ene 2009 año
1.572
-0.208
-11.7%
1 ene 2010 año
0.998
-0.574
-36.52%
1 ene 2011 año
0.948
-0.05
-5.03%
1 ene 2012 año
1.821
+0.874
92.15%
1 ene 2013 año
1.264
-0.558
-30.61%
1 ene 2014 año
1.713
+0.45
35.58%
Ranking de los países por los datos estadísticos actuales


Comentarios: