29
/es/
es
AIzaSyAYiBZKx7MnpbEhh9jyipgxe19OcubqV5w
April 1, 2024
220172
Papua New Guinea
PNG
true
2
1
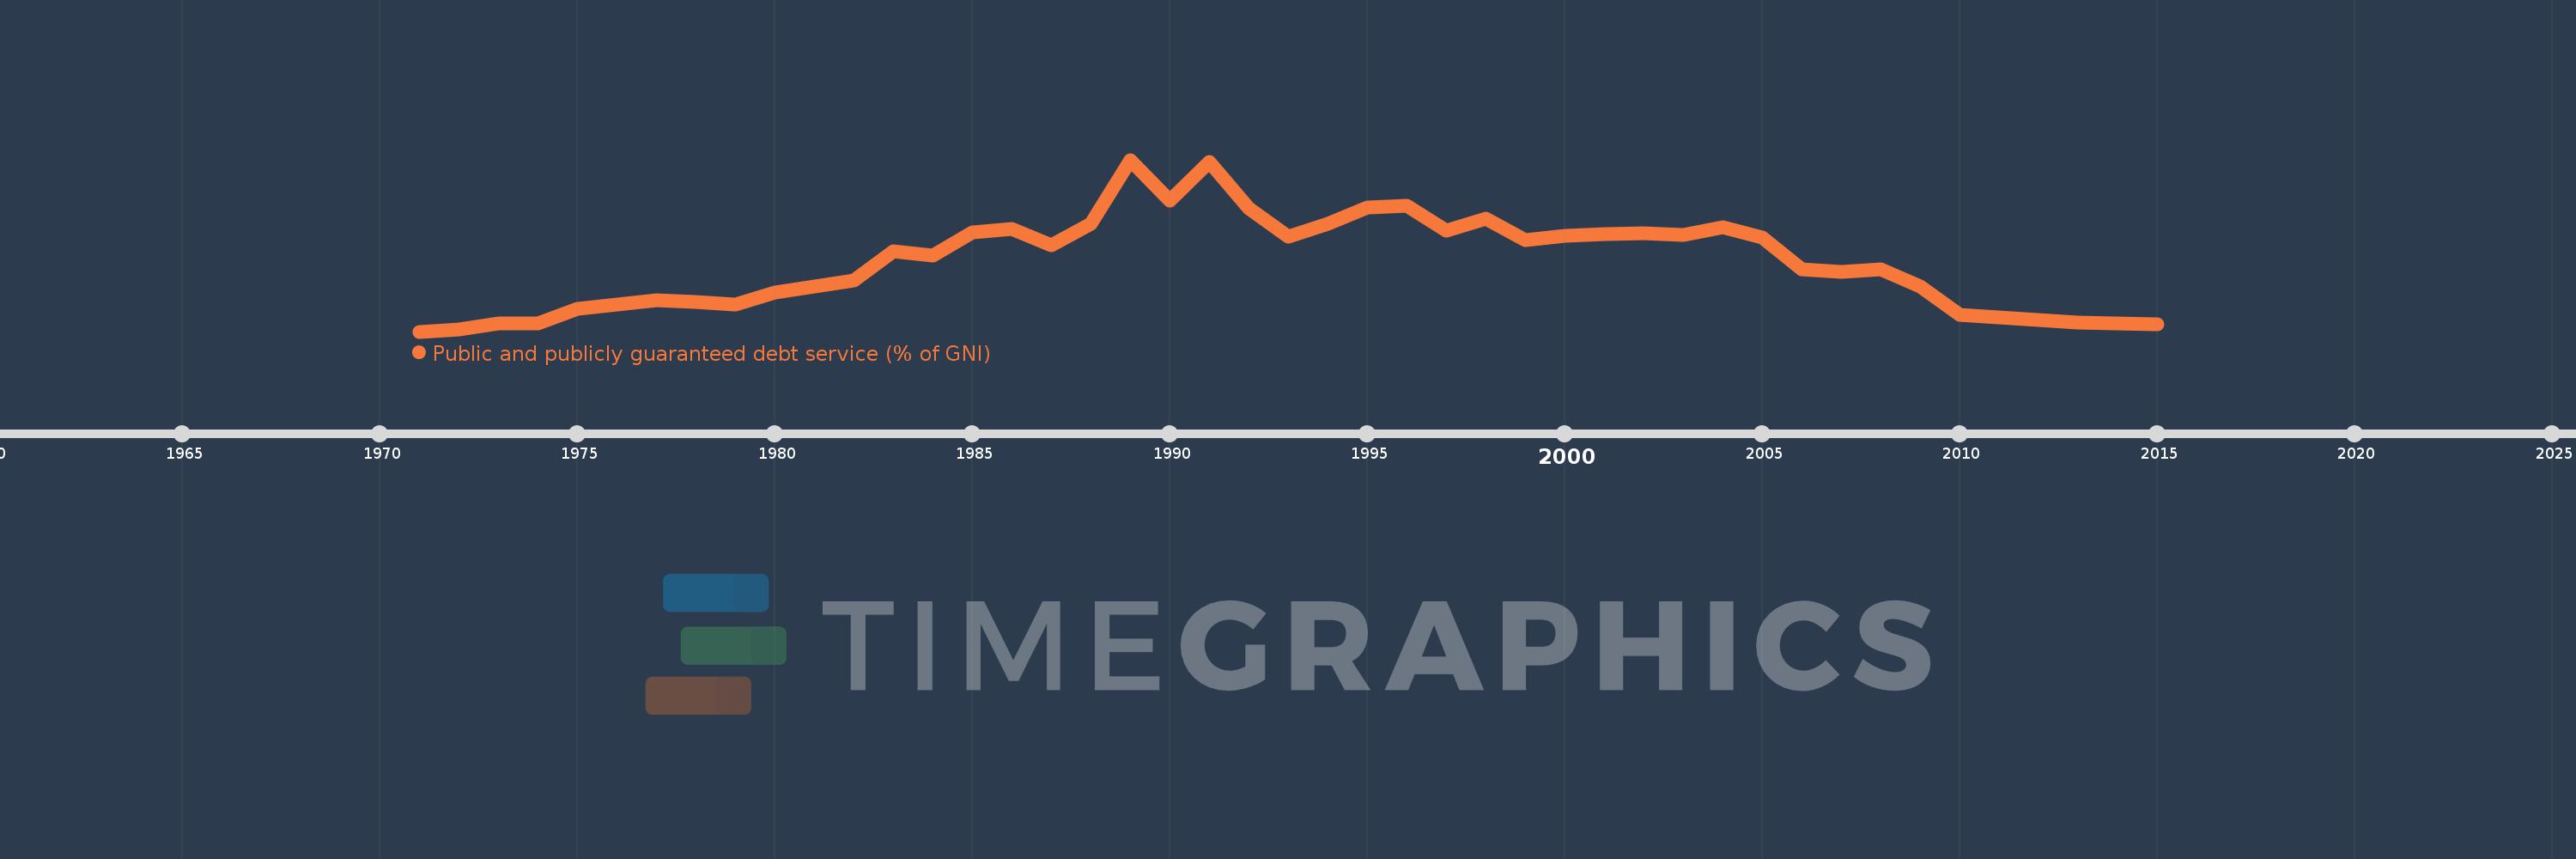
Public and publicly guaranteed debt service (% of GNI)
2015,2014,2013,2012,2011,2010,2009,2008,2007,2006,2005,2004,2003,2002,2001,2000,1999,1998,1997,1996,1995,1994,1993,1992,1991,1990,1989,1988,1987,1986,1985,1984,1983,1982,1981,1980,1979,1978,1977,1976,1975,1974,1973,1972,1971
Estas estadísticas en otros países:
línea de tiempo (timeline):
En esta escala de tiempo se presenta un gráfico de 1971 y 2015 de Papua New Guinea. Los datos de 1970 están ausentes. El número de observaciones reales por fecha: 45.
Fuente (nombre):
Indicadores del desarrollo mundial
Fuente (organización):
World Bank, International Debt Statistics.
Categorías:
External Debt
Se ha actualizado:
23 abr 2017 año
Los indicadores de los cambios de valor en los últimos años
Mínimo:
0.217
1 ene 1971 año
Máximo:
8.846
1 ene 1989 año
A la fecha de observación
Valor
Cambio absoluto
El cambio con respecto al valor anterior
1 ene 1971 año
0.217
+0.217
0.0%
1 ene 1972 año
0.337
+0.12
55.08%
1 ene 1973 año
0.623
+0.287
85.19%
1 ene 1974 año
0.617
-0.006
-0.99%
1 ene 1975 año
1.345
+0.728
117.99%
1 ene 1976 año
1.57
+0.225
16.73%
1 ene 1977 año
1.803
+0.233
14.81%
1 ene 1978 año
1.685
-0.118
-6.52%
1 ene 1979 año
1.595
-0.09
-5.35%
1 ene 1980 año
2.187
+0.592
37.11%
1 ene 1981 año
2.462
+0.275
12.6%
1 ene 1982 año
2.789
+0.326
13.25%
1 ene 1983 año
4.258
+1.469
52.69%
1 ene 1984 año
4.049
-0.208
-4.89%
1 ene 1985 año
5.202
+1.153
28.47%
1 ene 1986 año
5.366
+0.163
3.14%
1 ene 1987 año
4.538
-0.828
-15.42%
1 ene 1988 año
5.649
+1.111
24.48%
1 ene 1989 año
8.846
+3.197
56.58%
1 ene 1990 año
6.779
-2.067
-23.36%
1 ene 1991 año
8.73
+1.95
28.77%
1 ene 1992 año
6.391
-2.339
-26.79%
1 ene 1993 año
4.993
-1.398
-21.87%
1 ene 1994 año
5.63
+0.638
12.77%
1 ene 1995 año
6.473
+0.842
14.96%
1 ene 1996 año
6.552
+0.079
1.22%
1 ene 1997 año
5.271
-1.281
-19.56%
1 ene 1998 año
5.89
+0.619
11.74%
1 ene 1999 año
4.821
-1.068
-18.14%
1 ene 2000 año
5.046
+0.225
4.67%
1 ene 2001 año
5.129
+0.083
1.64%
1 ene 2002 año
5.146
+0.017
0.33%
1 ene 2003 año
5.06
-0.086
-1.66%
1 ene 2004 año
5.48
+0.419
8.28%
1 ene 2005 año
4.934
-0.546
-9.96%
1 ene 2006 año
3.357
-1.577
-31.96%
1 ene 2007 año
3.207
-0.15
-4.47%
1 ene 2008 año
3.361
+0.154
4.79%
1 ene 2009 año
2.461
-0.9
-26.77%
1 ene 2010 año
1.058
-1.403
-57.02%
1 ene 2011 año
0.918
-0.139
-13.17%
1 ene 2012 año
0.799
-0.119
-12.96%
1 ene 2013 año
0.656
-0.143
-17.94%
1 ene 2014 año
0.627
-0.028
-4.34%
1 ene 2015 año
0.568
-0.06
-9.52%
Ranking de los países por los datos estadísticos actuales


Comentarios: